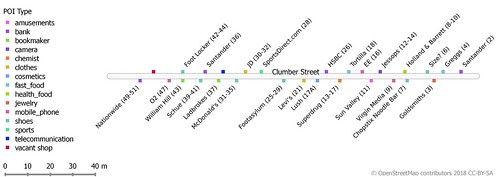
 |
| Clumber Street, a pedestrian shopping street in Nottingham |
We are all familiar with 1D, or linear, maps.
We see them in graphics at bus stops; use them to work out when it's our stop on the metro; there's even a whole genre of using the style of the London Underground map for other purposes. Here are one or two examples:
 |
| New York Subway line map from 1960s |
 |
| An excerpt from the Tabula Peutingeriana |
 |
| Bus stop showing typical public transport use of 1D maps |
 |
| A 18th century road itinerary for Northumberland Jeffrey's Fleuron (perhaps also a strip map) |
If you want to know more, Laurence Penney, from Bristol, gave a highly condensed version of his talk on these maps at the international State-of-the-Map conference at Birmingham back in 2013. He has a fantastic, and ever growing, collection of examples going back at least as far as the Tabula Peutingeriana a Roman scroll of road itineraries (as a 19th century facsimile.
Like cartograms, 1D maps were always a map style which I have wanted to create using OpenStreetMap data. Over the last few years I have made sporadic efforts to see how I might create them, and for quite some while I have had a reasonable notion for a workable approach. However, doing so required a fairly concerted effort to break through the little annoyances which occur at every step. In the past couple of days I have made just that effort, and seem to have something which is reasonable, and certainly meets my initial goals.
Why Now?
The reason why I knuckled down to the task was pragmatic.For several years we have spent an hour before our summer pub meetings in the East Midlands (Nottingham and Derby) mapping areas close to our meeting place. These partly help to improve OSM, but were also conceived as a way to show interested parties what was involved in mapping. This year I felt that it would be worthwhile to focus our energies in this hour on checking the centres of Derby & Nottingham for change.
As OpenStreetMap data becomes richer the issue of maintaining existing data becomes more pressing. Amenities, shops and other points of interest in town and city centres are particularly prone to change and are often changes are often difficult to spot in any systematic way. It seems axiomatic that we should strive for a means which makes checking existing data somewhat less arduous than the effort it took to create in the first place, but often that is not true. Some editors, do help a bit: Vespucci, for instance, highlights objects which have not been touched by an edit within the last year.
Clearly something which reduces the quantity of information to validate ought to help: hence 1D maps.
Outline of the technique.
As I stated above, I've had a reasonable idea of how to approach the problem for a while. These are the key steps I envisaged :- Merge all ways belonging to a particular road (identified by a common name and/or ref).
- Create a single centre line for the road (to eliminate spurs, dual carriageways, roundabouts, service roads etc).
- Identify all POIs belonging to a given street: this might be because they have the appropriate street name or are within a given distance of the street centre line (corner buildings, for instance may belong to another street, but be equally prominent on the intersecting one).
- Locate the POI along the centre line, and, importantly, which side of the line it is located.
- Calculate distances along the centre line.
| Name | POI Type | Distance Along (m) | Side of Road | Distance Offset (m) |
|---|---|---|---|---|
| Curry 77 | restaurant | 173 | R | 21 |
| The Salutation | pub | 192 | R | 24 |
| Cumin | restaurant | 218 | L | 18 |
| Nottingham Credit Union | bank | 227 | R | 29 |
This format gives enough data to work on a suitable rendering.
In practice the second point is what took most time, so in the rest of the post I'll describe the steps in detail. I make no claims for elegance, and some of the steps I certainly didn't use the perhaps the best tools. Be warned there is a lot of nitty-gritty stuff below!
Step by Step guide
The Road Network & POIs
I used two Overpass-Turbo queries to download all highway ways and a discrete set of POIs (all amenities, shops and offices) from the same bounding box. Data was downloaded as Geojson and immediately uploaded into PostGIS (using the QGIS DBManager). I converted everything to the British Grid on upload which simplifies distance calculations, but also gives some 'safe' areas to locate transformed data at the end.Next I grouped all highways with the same name into multilinestrings:
SELECT nextval('street_seq') street_idThe additional st_multi is needed because most roads will still be a single linestring when merged with the union function. Operations also need to work with more complex roads, so they are all treated in the same way.
, name
, st_multi(st_union(geom)) geom
FROM hwy_upload
GROUP BY name
Generating a Centre Line 1 : creating an approximate medial axis
The first operation in generating a central line is to buffer the entire multilinestring by some arbitrary value (20 metres worked for me), and then use st_approximatemedialaxis (discussed extensively in an earlier post) to create a first cut medial axis.There are several problems with the medial axis generated by the PostGIS functions:
- In many cases it cant be resolved to a line.
- It's a multilinestring (I think even if the linear segments can be merged into a linestring).
- It appears that it is constructed of many 2-point lines.
- Some of the piecewise linear segments are minute (nanometres in length IIRC)
- There can be many short or very short stubs.
Some can be reduced by using st_snaptogrid. Using a 1 m snapping grid is absolutely fine for my purposes and eliminates some of the more absurdly short segments. After considering various ways of pruning the medial axis graph I instead decided that routing through it was easier to try.
Generating a Centre Line 2: using pgrouting
As I had the data in PostGIS pgrouting was a fairly obvious candidate to generate routes. It is a relatively lightweight set of tools for generating routes and trivial to installTo prepare the data for pgrouting I decomposed the medial axis multtistrings using st_dump and stored them in a new table.
I also extracted all the points (node) from the original road linestrings and for each street found the pair of points which were most distant from each other. These two points would be used later as the source and target nodes for routing:
WITH st_pt_distance AS (As I only want routing along an individual street it was not obvious if I could safely use a single table for pgrouting. I therefore decided to use a temporary table for each street, and iterate over each street using a Postgres stored procedure. Streets with inconvenient geometries (such as those having two exterior rings when buffered) are eliminated at this step.
SELECT street_id,
a.pt_id source_pt_id, b.pt_id target_pt_id,
a.pt_geom source_pt_geom, b.geom target_pt_geom,
st_distance(a.pt_geom, b.pt_geom) distance
FROM hwy_pts a, hwy_pts b
WHERE a.street_id = b.street_id
AND a.pt_id <b.pt_id
)
SELECT street_id,
FROM st_pt_distance
WHERE distance = (SELECT street_id, max(distance)
FROM st_pt_distance
GROUP BY street_id)
 |
| Examples of buffered roads with rejected geometries (mostly in 2 or more parts). Some are correct others needed fixing |
- Create the temporary routing table:
CREATE temp_table AS
SELECT a.street_id, (st_dump(aml_geom)).path street_seg_id,
(st_dump(aml_geom)).geom as geom,
st_length(st_dump(aml_geom)).geom) as cost,
st_length(st_dump(aml_geom)).geom) as reverse_cost
FROM hwy_upload
WHERE a.street_id = <value> - Prepare the table for pgrouting:
SELECT pgr_createtopology('temp_table', 0.0000001,'geom');
This routine creates another table temp_table_vertices which contains the nodes (vertices) of the routing network). Useful to remember when cleaning up the temporary tables. (I'm not sure why I used such a small value for the second parameter. I think I was worried about the very short segments which I later eliminated). - Create a route. I used the standard pgr_dijkstra call which returns a list of all vertices and edges making up the route:
SELECT *
FROM pgr_dijkstra('select street_seg_id,
source,
target,
cost,
reverse_cost from temp_table',
(SELECT id FROM temp_table_vertices_pgr
WHERE geom = (SELECT start_pt from hwy_upload
WHERE street_id =<value>)),
(SELECT id FROM temp_table_vertices_pgr
WHERE geom = (SELECT end_pt FROM hwy_upload
WHERE street_id =<value>)) - In principle I should have been able to just use st_linemerge to assemble the parts of the route, but I found some small gaps which prevented the function from working. Instead I used the ordered set of nodes and made the line from them with st_makeline. This approach rather relies on the medial axis segments only having 2 points. (This may have been related to the short segments, but I haven't tried the original technique since then):
SELECT st_makeline(pts) geom from (
SELECT c.*
FROM
((SELECT b.street_seg_id,seq,node,edge,agg_cost, geom,
st_pointn(b.geom,1) pts
FROM pgr_dijkstra(<see above>) a
JOIN hwy_aml_dump b on edge=street_seg_id)
...
Adding the POIs
It is now trivial to calculate position along the centre line for each of the selected POIs using st_linelocatepoint:SELECT street_id, poi_id,The offset from the centre line is given by st_shortestline, but we need one other piece of information: where the POI is to the left or right of the centre line. Unfortunately it is not possible to rely on the shortest line dropped to the street centre line. It needs to be extended slightly to ensure it crosses the street centre line. Doing this is fairly painful in PostGIS (best managed with a simple function, see GIS Stack Exchange for examples):
st_linelocatepoint(
st_pointn(
st_shortestline(poi.geom,street.centreline_geom),
2),
centreline_geom)
* st_length(centreline_geom) distance_along_street
FROM streets street, pois poi
WHERE street.street_id = poi.street_id
SELECT st_makeline( /* line from POI to 5 m across centre line) */Now the st_linecrossingdirection function works every time, and because these are simple straight lines we can assign POIs to left or right.
geom, /* POI location */
st_translate(geom, /* xsect_geom is intersection point */
sin(st_azimuth(geom, xsect_geom ) *
(st_length(st_shortestline(geom,xsect_geom ))+5),
cos(st_azimuth(geom, xsect_geom ) *
(st_length(st_shortestline(geom,xsect_geom ))+5))
FROM pois
Pulling it together
 |
| Maid Marian Way in central Nottingham showing the calculated central line (orange) and short lines (red) from POIs. This is a topologically complex road. |
I will add queries & other code to github in the near future, probably as GISTs for now. Much of this was driven by wanting something to hand for our first mapping evening, and in many cases I went with what I could get to work quickly rather than investigating why a given result was unexpected.
One other unexpected benefit is that I discovered a few bugs in OSM data. As is often the case when one looks at a larger set of data inconsistencies and minor errors stand out rather quickly.
Great work, Jerry! This is exactly the sort of thing that can make OSM editing more accessible. I can see a version being given to schoolkids to do geography field work. - Jez
ReplyDeleteSo glad to see OpenStreetMap using linear mapping, keeping things simple. When I travel for work and use GPS apps on my phone, I rely on the simplest linear maps to get me to my destination. It would be great if you based your company identity on using simple linear mapping, because it's so hard to find! It's great to hear that you identified some errors and eliminated them!
ReplyDelete