 |
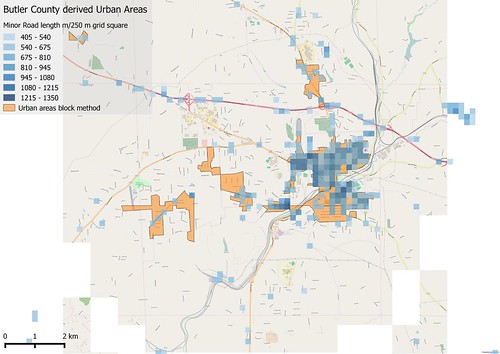
| Coastal Townlands, Counties Derry/Londonderry and Antrim. Boundary lines see below. The deeper the colour of the area, the greater discrepancy in the area of the OSM polygon and the OSNI one. The pale base colour represents a divergence of under 2%. Townlands on the coast and on the UK/Ireland border seem to be most likely to diverge in size. The small cluster centre right is caused by different ways of handling townlands which cross a Civil Parish boundary (OSM & the original source GSGS 3906 split these, the OSNI data does not). |
 |
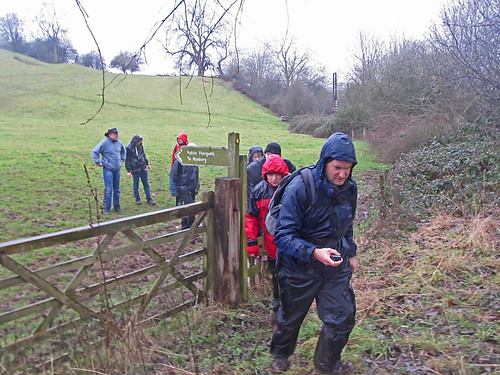
| View along N side of MacGilligan Peninsula towards Inishown from Umbra |
My reasons for doing this are not just pure interest. The usefulness of the Irish Vice County boundaries depends of their positional accuracy. Earlier my prediction was that such boundaries ought to be within 10 metres of their true location on the ground where they were based on townland boundaries, but this was largely based on experience with other OSM data rather than an objective statement. Thus investigating the accuracy using an independent data set provides an excellent way of testing this statement. The tests need to be done now, because (as we shall see) the nature of OSM is to fix issues spotted very quickly, and thus datasets become loosely coupled.
I adopted two approaches:
- A straight comparison of areas (or their ratios).
- Using a series of buffered boundaries from one source (OSNI) and seeing what proportion of the other source (OSM) was included in each buffer.
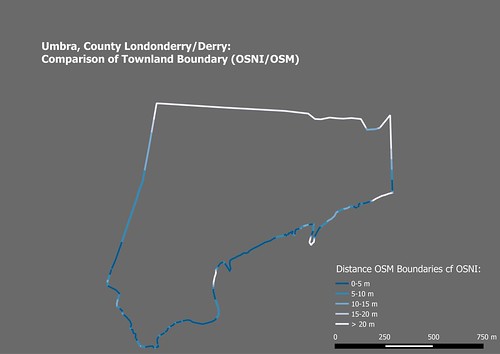 |
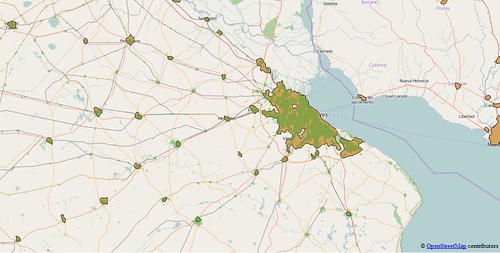
| Buffering approach to investigating boundary accuracy. Demonstrated with Umbra townland in County Derry/Londonderry. This is predominantly coastal sand dunes, with a small river running along its S boundary. |
 |
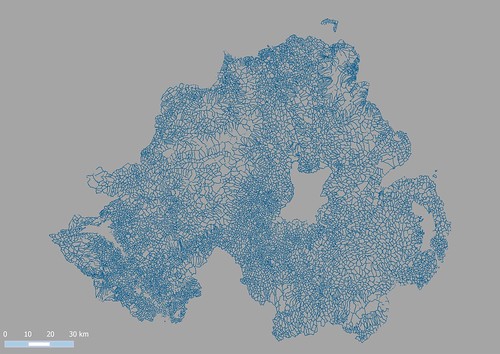
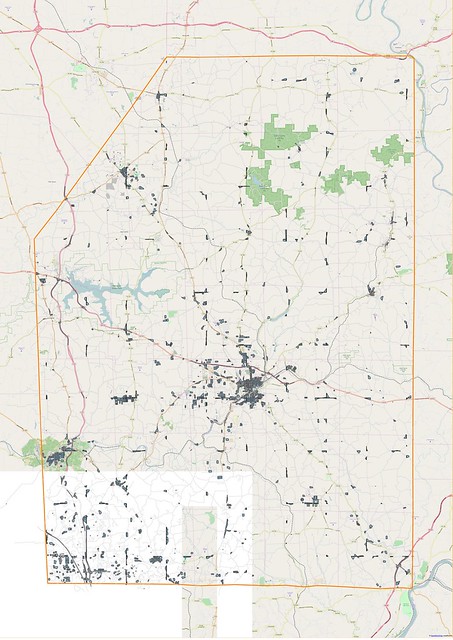
| Northern Ireland using the same colouring. At this scale very few boundary mismatches are apparent. |

 |
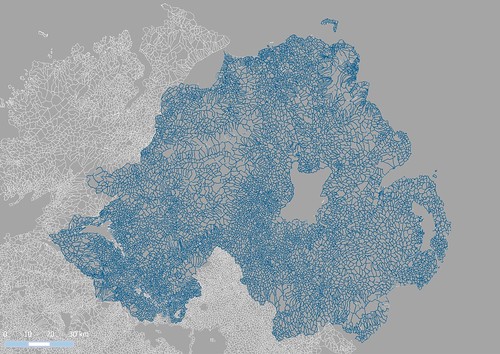
| OSM townland Boundaries within 5m of OSNI data |
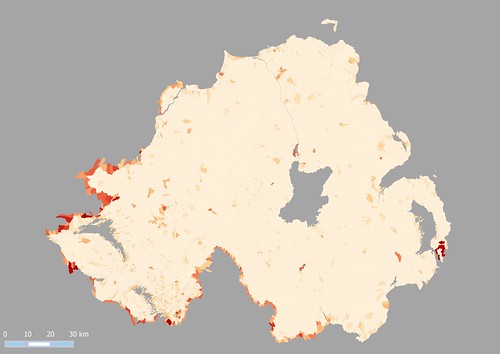 |
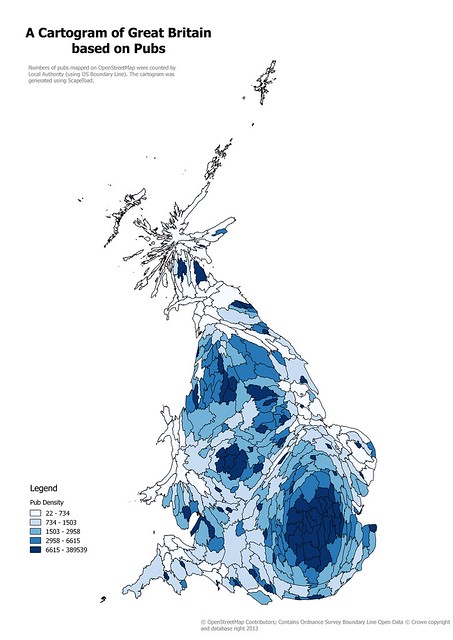
| Area comparison. Townlands are coloured according to absolute variance of ratio of areas from 1. The redder they are the further the ratio is from 1. |
- Boundary discrepancy (such as coastlines). Mainly caused by coastlines, or difficulty of delineating some boundary feature, such as the course of the Umbra river above)
- Erroneous interpretation of the boundary on old maps causing selection of the wrong feature. This transfers land from one townland to another, therefore these should cluster.
- Missing townlands. When a single townland has been created without noticing one or more others inside it (Town Parks townland at Ballymoney is an example).
- Different treatment of townlands bisected by a Civil Parish. See caption of first image above. Incorrect tagging.
- Higher level administrative units having tags appropriate to a townland. I've noted two cases of this one of which was Ballyphilip CP on the Ards peninsula in County Down.
- Islands. Some offshore islands appear to be missing from the OSNI data (see The Skerries N of Portrush)
To conclude, townland boundaries show exactly the kind of positional accuracy we expected (or perhaps hoped). Perhaps 1% of the total data (90-100 townlands from about 9000) may need some form of correction. I'm biased, but this seems pretty good, for a project principally relying on rectified photo-reduced maps from 1939! It's also worth remembering, that unlike road comparisons, there is no widely available sensor data (ie GPS tracks/point) to help boundary alignments.
When time permits I'll extend this to include OSI Open Data too. A big thanks to both organisations for releasing their Open Data. OSNI staff have been contributors to OSM for a while: they host Missing Maps lunchtime sessions in their offices.


