I start by seeking inspiration from the many ways in which woods and trees have been shown on maps in the past, and then consider what elements we may want for OSM data, and how we might depict such elements.
Historical Background to mapping Woods and Trees
This background is limited to cartographic traditions originating in Western Europe. This is simply because more images are available, and they tend to be easier for me to access and interpret. The main purpose is to show that there is long an distinguished history of woodland cartography, with much of interest in developing ideas for such cartography with OpenStreetMap data.For Chinese map-making a good starting point is Volume 2 of a Shorter Science and Civilization in China, although as I don't have my copy to hand I don't know if it deals with woodland mapping directly.
 |
| Map of the Suruga region, showing Mount Fuji (c. 1830) source Wikimedia Commons. More details. |
Hugh Brody's Maps and Dreams is a good place to get an idea of the extensive topographical knowledge of modern hunter gatherers. I suspect that at all times in human history people have shared knowledge about woodland resources.
I've not restricted my examples to woodland alone: depictions of trees in cities and agricultural countryside are also included.
Imperial Rome
Thanks to Matthew Nicholls who has created a wonderful 3-D model of Rome around 315 C.E, I was introduced to Forma Urbis Romae a fragmentary very large scale (~ 1:240) map of Imperial Rome created in the reign of Septimus Severus (203-211 CE).In context of this blog, this is the earliest map I am aware of which may show trees: mapped as round circles, but difficult to separate from columns and colonnades. Obviously using marble as a cartographic medium provides some constraints in symbology!
 | |||
| A fragment of Forma Urbis showing the Theatre of Pompey, the dots at lower centre may be trees or stone columns. Source: Wikimedia Commons. |
Britain and Ireland
Trees have formed an important part of defining boundaries in England since Anglo-Saxon times (c. 600-1050 CE). Books by Hoskins (The Making of the English Landscape) and Rackham (The History of the Countryside) provide many examples of Anglo-Saxon charters making use of individual trees, and areas of woodland to define boundaries. I picked one charter at random for Nottinghamshire, and it includes mention of both woods and individual trees. Of course these descriptions are not maps, but they show what were considered notable features.My first example map is from 500 years later. There are many detailed estate plan available from this period which show individual tress and woodland, but here I've been restricted to what is available in the Commons. A couple of early plans of towns with royal founder (Westminster & Beaumaris) show that individual trees were incorporated into maps more or less standardly at this scale. Norden's Westmnister map also shows a range of vegetation types on the South bank of the Thames at Lambeth.
.jpg) | ||
| Norden's 1593 map of Westminster, Middlesex (now London) Source: Wikimedia Commons. |
 |
| Speed's 1610 map of Beaumaris Source: Wikimedia Commons |
My next two examples are small scale maps made by continental cartographers in the middle of C17. In both cases woodland is represented symbolically by relatively small groups of trees. Although these are true maps the overall symbology is obviously inherited from the 'bird's-eye' tradition.
 |
| Knapdale by Blaeu 1654 Source: Wikimedia Commons |
 |
| South Wales by Wenceslaus Hollar Source: Wikimedia Commons |
.jpg) | |
| Hastings area. 1st edition Ordnance Survey map, surveyors draft. Source: Wikimedia Commons |
 |
| Excerpt of WWI military map showing woodland |
 |
| Excerpt of WWI Military Map showing a tree-lined road |
My last historical examples of British cartography are from WWI military maps of France (courtesey of Rob Warren and the Muninn Project). These are fairly typical of many maps of the time (such as OS 25inch and 6 inch maps). Symbology of trees and woodland is not radically different from that used a hundred years earlier, and equally clearly shows its relationship to the maps of Speed et al., 300 years before.
Germany
I'm not as familiar with old German maps as I am for those from Britain, France and Switzerland. Therefore I've only chosen one example from the maps of forest made by Georg Gadner at the end of the C16 for the Duke of Württemberg. |
| Leonberger Forst by Georg Gadner (late C16) Source: Wikimedia Commons |
This map, although at a larger scale is similar in overall symbology to the two maps of Britain shown above.
Switzerland
My examples from Switzerland come from the two major national mapping schemes of the 19th century; the Dufour and Siegfried maps. |
| Extract from Dufourkarte around Buelach showing several woods. |
 |
| Extract from the Siegfriedkarte around Bremgarten (AR) showing woodland and orchards. |
Russia
Unfortunately there are very limited image resources of early woodland mapping in Russia, but there is an extremely informative paper by Alexei Karimov based on archival materials. The fascinating thing is that mapping of woodlands was one of the starting points for true cadastral surveys in Russia. Peter the Great was anxious to establish a navy and thus all woods which could provide materials for shipbuilding were seen as a strategic asset. Ironically whilst Peter the Great was studying shipbuilding in England he and his courtiers had trashed the house of John Evelyn, the author of Sylva, the first major work on trees in English.Karimov has a collection of small sample maps online. These are adequate to see that as early as the start of the 18th century there was a strong focus on displaying woodland on maps (and one or two maps are thematic in that they only display woods suitable for ships masts). The original surveys were based on the pre-existing cadastral techniques which dated back to the middle-ages. During the Petrine period survey techniques from Western Europe were adopted.
 |
| Countryside around Troitsk (Троицк), SW of Moscow Map dates from mid-19th century Source: Wikimedia Commons |
Soviet Era Maps
Although these maps don't strictly fall within the time bounds for this section, I've included them because they are a major source of inspiration. This is because not only was the Soviet Union a huge country containing a very broad range of woodland types, but also because the cartography was global in scope and therefore covers everything from marginal forests on the edge of the tundra to tropical mangrove swamps.

Conclusions
The objective of this section was to show how deeply embedded the depiction of woodlands is in the European cartographic tradition. Furthermore the range of approaches used over the years ought to provide us with ideas for how to capture and represent such data using OpenStreetMap.Broadly, to show respect for this long tradition, I think we can and should do better with OSM data.
Cartographic Styles for Trees and Woodland.
The remainder of this post is concerned with developing some ideas in this respect.Modern Cartography
For the sake of completeness I've also included some examples of modern cartography.Thematic Forest Mapping
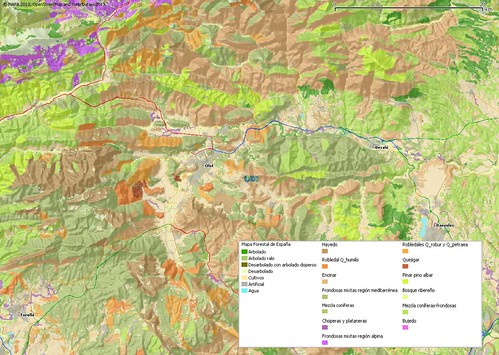
Most countries in Europe have some regular survey of forests and woodlands, and in many cases these resulted in a wide array of cartographic products. With the widespread availability of GIS, such data is more likely to be held in and consumed by digital means.Some thematic maps from the Forest administration of Baden-Wurttemburg were shown in an earlier post. For this post I've selected a couple of examples of thematic maps produced by the Spanish National Forest Survey of the Ministry of Agriculture (MAGRAMA).
 |
| Map Forestal de Espana, Figueres sheet. Note the primary division between Boreal, Caudophyll, Sub-sclerophyll and Sclerophyll forests Source: Magrama. |
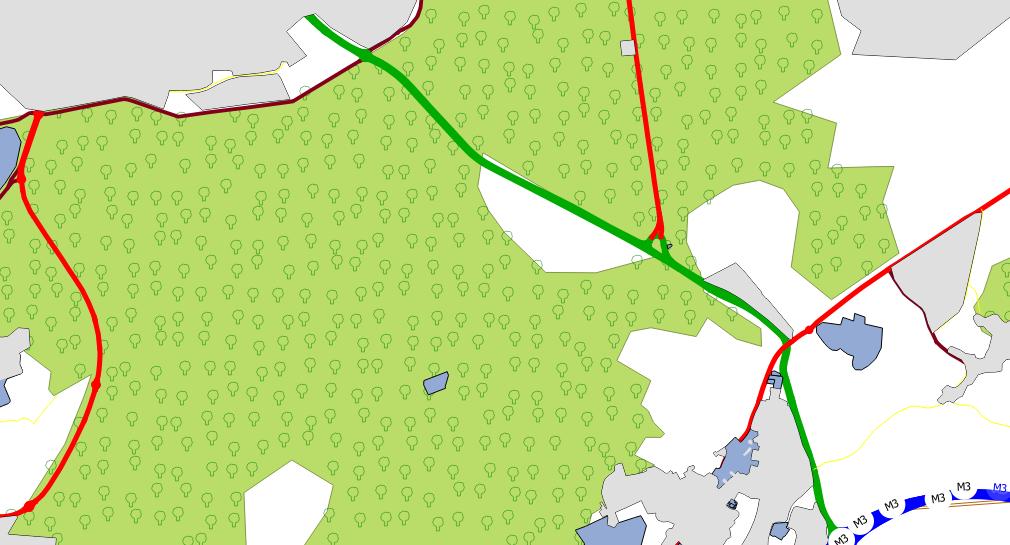
The IFN also have a WMS service showing woodland areas by dominant tree type, so the Olot area looks rather different as in this map (also from an earlier post).Note how different these thematic maps appear and yet they are based on the same data.
 |
| Woodland distribution around Olot, Garrotxa. Source: IFN. Town and road network provided to aid context from OpenStreetMap. Shaded relief derived from SRTM Data. |
OpenStreetMap
Apart from the styles shown on the main OSM webpage (so-called Mapnik, OpenCycleMap etc) which both used a stylised pictorial symbology, there are a wide range of other maps with some good ideas for woodland symbology using OSM data. I've chosen two examples I particularly like which make excellent use of abstract symbols:
 | |
| Maperitive rendering of OSM data at a scale of 1:25k in a style similar to the French IGN Top25 maps. Note the highly effective use of abstract symbols (circles and triangles) for denoting woodland. Source: OSM Wiki |
SwissTopo
Modern Swiss maps have taken the abstraction already apparent in the Siegfriedkarte to its logical conclusion and show forests with a simple green fill. However, these maps do have interesting ways of showing scattered trees, for instance at the forest edge, and also for showing when the edge of a wood is indistinct. |
| Vegetation conventional signs from SwissTopo pamphlet From left to right 1:25k, 1:50k and 1:100k |
Summary
Overall consideration of both historical and contemporary mapping of woodland reveals three approaches to representing trees and woodland:- Pictorial symbology. This is probably the style which was most used in older maps. Usually trees or woods were depicted as if seen obliquely from the air.
- Overhead symbology. More apparent in 19th century maps is the treatment of trees (and woodland) as if seen directly from above.
- Abstract symbology. Ironically, this is the form with the oldest usage discussed above (in Forma Urbis Romae), but increasingly popular from the late 19th century onwards. Many forms of abstract symbology are clearly derived from earlier approaches. The advent of widespread colour printing for topographical maps led to the most abstract (and in some ways the least informative) approach of just showing woods as a green fill.
Towards a Symbology for Trees and Woodland
The remainder of this post consists of a few ideas about developing the symbology of trees and woodland for OSM. All the material above has been a source for ideas and inspiration. However, the longer I work on this the more ideas I have so I have just made an artbitrary cut so that I can finish the post!Symbological Elements
By looking at a wide range of woodland mapping I've been amazed at the scope of what cartographers have tried to show concerning woods and forests. I am sure some of these are perhaps too arcane for OSM, but they represent a rich source of ideas. In many cases some experimentation is required to see how they could be represented using the typical digital cartographic tools in use at the moment.- Woodland Type: by this I mean the main categories we already use: coniferous, broad-leaved, evergreen, deciduous (tags wood=* and leaftype=*), and the more minor categories of dominant species or phytosociological classification. I have some more developed ideas on this area so will save them for another post in this series. But see examples of leaf-based symbology on the wiki.
- Woodland Management: Older Ordnance Survey maps showed several forms of woodland management: coppice with standards; osier beds (willows grown for basketmaking); brushwood. Some places in Britain are still coppiced and there are a small number of osier beds in Norfolk, Somerset and elsewhere. Usually the symbol for how the wood is managed is interspersed with symbols showing the type of wood. Coppiced woodland is still represented on the Ordnance Survey Explore series (see p. 2 of this pdf).
- Woodland Boundaries. Both SwissTopo and OSGB have ways of representing hard and soft woodland boundaries. As we map hard barriers already in OSM perhaps these could be combined.
- Former Woodlands, The main categories here are showing recently felled woodland (either as part of a regular clear-felling of forest compartments or of de-forestation), and woods which have been burnt. Both categories may also be showing signs of re-generation.Options include explicit pictorial or abstract symbols or some kind of partial hachuring (for instance break up fills into diagonal stripes). Some former woodlands will be regenerating as scrub and ideally any symbology would allow both together.
-
Canopy Height. Seen on Soviet era maps as a small annotation or ornamentation adjacent to symbols. I'm not aware of anyone collecting such data for OSM, but it is clearly an interesting thing to have even if not that straightforward to acquire.
- Woodland Density. In the extreme we need to show scattered trees in parkland (as was mentioned by Huw Davies at SotM-13), or at forest edges (such as the treeline), but this applies to proper forests and wood pasture (such as Dehesa) too. The obvious approach is to relate density of symbology to tree density. For very scattered wooded areas density can be calculated from aerial images, whereas in typical forests there are plenty of well-established techniques.
- Ground Layer and Field Layer. We already manage this when the ground layer is a swamp, perhaps we could find ways to convey other aspects of the woodland, and even on large scale maps something about the dominant plants in either of the layers. (I was recently in a mixed woodland where the field layer was Bracken, and represented more truly the original state of the wood before being managed for timber).
- Woodland Usage. The most important one is restoring the ability to identify woods predominantly used for timber extraction: the original intended meaning of landuse=forest. Other significant usages include Palm Oil plantations (some may be covered by landuse=orchard tag, but this over-extends the meaning of that tag), smaller poplar plantations and possibly some biomass plantations.
Size and Scale Issues
A significant factor in the use of any symbology are legibility and intelligibility. I have therefore measured symbol sizes on a range of topo maps from several countries, and over several scales. Overall the vertical height of most symbology lies in the range of 0.75-2 mm for mid-scale maps (1:10,000-1:50,000). Symbols can be as large as 5 mm on large scale maps. Depending on assumptions regarding screen pixel density these sizes correspond to a relatively low pixel count if one assumes the old standard values of 72 ppi or 96 ppi.My initial impression is that abstract symbology will work best for many zoom levels when rendered for the screen as these will be clearer with small raster images. In this case pictorial symbology will only come properly into play once symbols of 8 pixels or more do not obscure other details.
Production of maps intended for printing or retina displays will obviously provide more freedom of choice.
Randomisation of Symbology
I cannot recall if it was in 2010 or 2011 that I first heard Steve Chilton talking about wanting a way of randomising the placement of symbols in the Mapnik polygon symboliser. Simple experimentation using QGIS shows how much this improves the appearance of woodland symbology. | ||
| Ordnance Survey Open Data Meridian with a conventional gridded symbology. |
 |
| The same area with pseudo-randomised symbology |
QGIS doesnt support randomised symbols either, so I created a grid over the woodland polygons in PostGIS, and then pseudo-randomised the grid positions using PostGIS functions and a random number to alter direction from the grid point with a fixed distance. Of course distance could be randomised too.
The problem with this approach is that one has to put a negative buffer around the polygon to avoid the symbols extending outside the woodland polygon. Furthermore it is potentially computationally expensive, and probably not suitable for the typical rendering used on OSM.
After doing this I noticed that the OS Landranger series (1:50k) use a grid symbology on forestry plantations and a pseudo-randomised one for natural woodland (note the subtle differences N of Weem here.
Colours : fills and symbols
Colour is clearly an important means of conveying information about woodland. My feeling is that this may be best achieved with a restricted palette of perhaps 3-4 colours. At least two are needed for fills and any associated symbols and ornamentation. Two colours of symbology would allow distinction between, say, evergreen and deciduous. Symbols can also be used as outlines or themselves filled. Some cartographers have used slightly different fill colours to distinguish broad-leaved from coniferous trees, the latter fill having a glaucous tint.Summary and Conclusions
Various ways in which trees and woodlands have been displayed on maps were shown to provide a baseline of ideas for developing suitable cartographic approaches for OpenStreetMap. Obviously many of these ideas need further elaboration & experimentation. The main objective of this post was to provide more detail, background reading and outlines of ideas presented in my talk at Karlsruhe.The diversity in the range of these maps provokes a multitude of other interesting questions about the development of cartography, older use cases, engraving, printing and other aspects of map production. I suspect that I may follow some of these up when time permits.
No comments:
Post a Comment
Sorry, as Google seem unable to filter obvious spam I now have to moderate comments. Please be patient.