Friday 28 June 2013

The Shopping News: mapping retail outlets in Nottingham

Nottingham Open Data 6


ng_retail__detail20130613
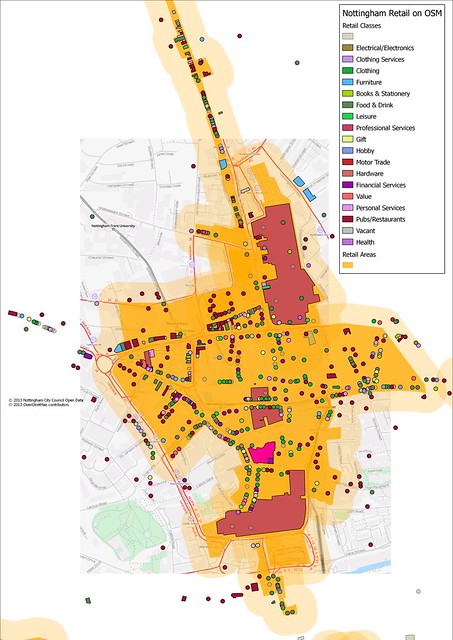
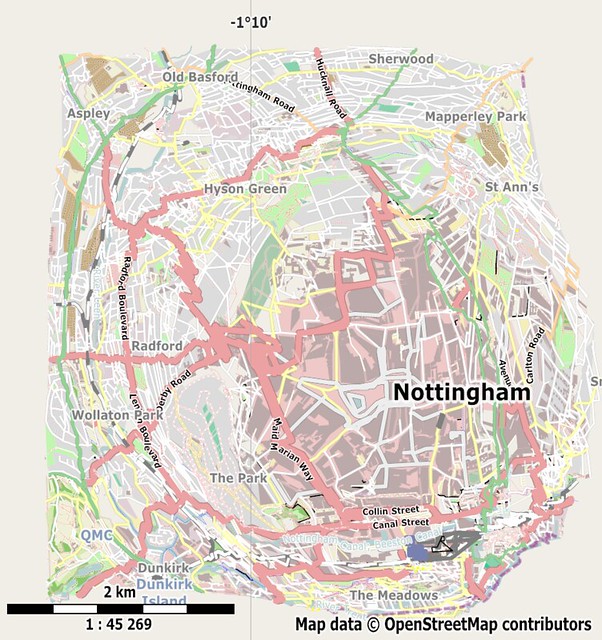
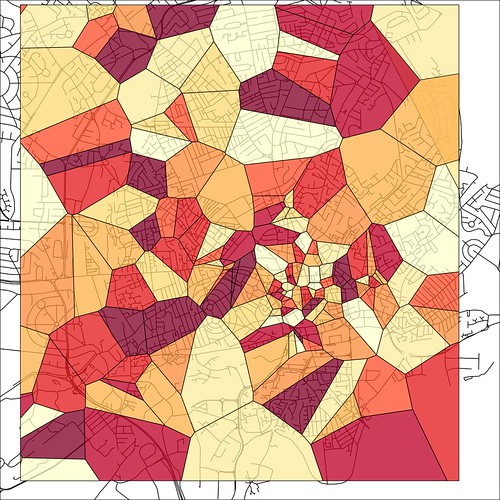
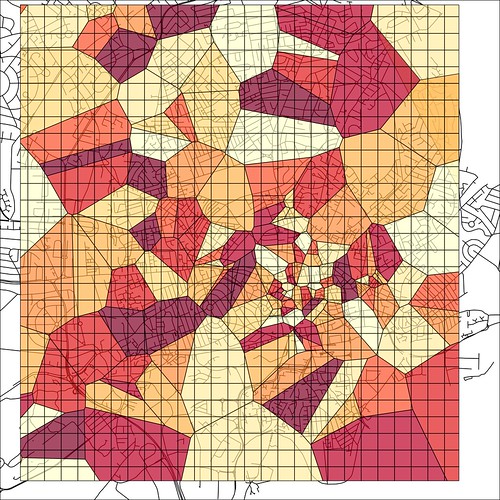
Nottingham City Centre retail areas with mapped retail units
(shops, banks, pubs, restaurants, cafes, fast food outlets etc.;
the large areas are shop=mall (an unsatisfactory tag)).

ng_retail_20130613
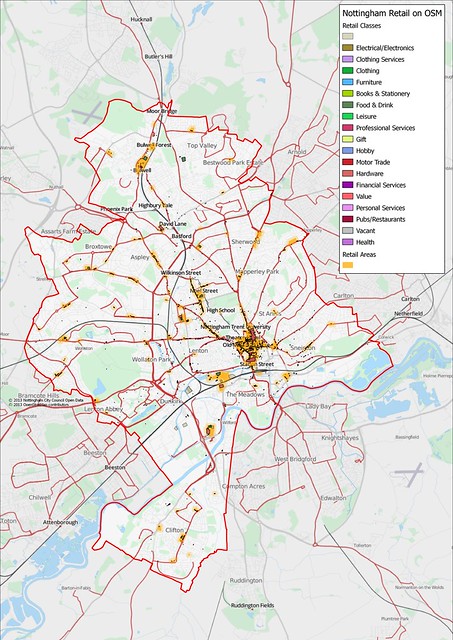
Retail landuse and retail outlets in the city of Nottingham
(a buffer is used to accentuate smaller retail outlets)

This morning I achieved one of my targets for using Nottingham Open Data. This was 90% reconciliation of the Licensed Premises dataset (this compares with around 40% when I first blogged about it).

Tabulation of reconciliation of Nottingham Open Data Licensed Premises File vs OSM
(loaded as an image because turning my Excel stuff into an HTML table is a PITA).
It seems like a good time to take stock (pun intended) of my retail mapping within the city of Nottingham.

ncc_miss_lic_pcs_20130628
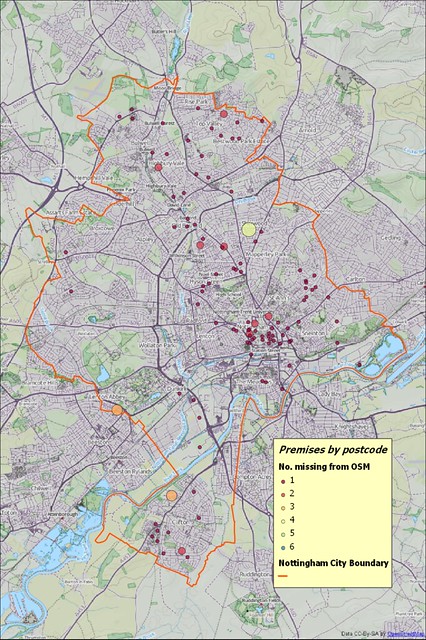
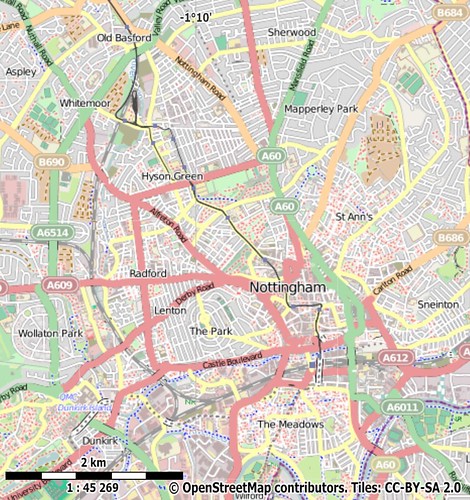
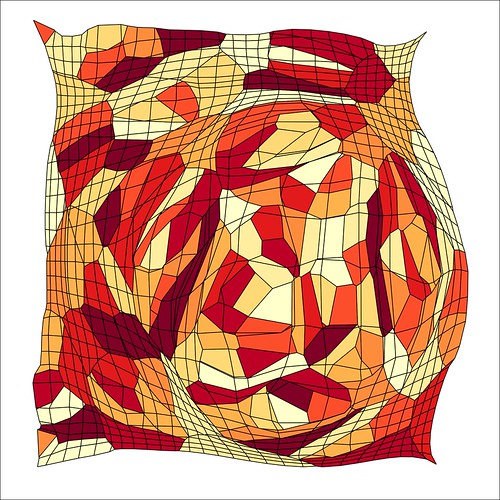
Licensed premises from Nottingham Open Data not reconciled to OpenStreetMap
(plotted as number of premises at postcode centroid) cf. with original map.
I started doing this when my mother asked me to take her to church and I realised that I could do a short productive mapping session whilst she was at the service. For the following 2-3 Sundays I mopped up as much as I could in the area close to her Church. Then at the end of April I got serious and instead of doing my shopping locally I drove to other groups of shops when I had an errand. In this way I've visited the majority of local shopping areas (with two major gaps: Mansfield and Carlton Roads).

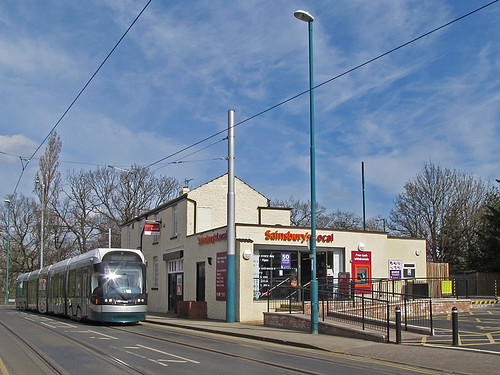
Most mapping sessions have been just over an hour in length, mainly involve photo mapping and seem to generate a huge amount of data. With a small number of exceptions in the City Centre I haven't done repeat surveys. Apart from trying to take lots of photos I have not tried to map everything I came across, which has been my usual approach in the past. I started doing this on my first outing, and took 30 minutes before I mapped my first shop, and had only 10 minutes for other shops, so I was going to take forever doing it my old way. So I stopped worrying about grabbing everything and just tried to get shops, but did collect other information if it was convenient and readily accessible.

I distinguish between these two styles of mapping, by analogy with farming, as intensive and extensive. In one we put all our efforts into maximising yield (of crop, or OSM data) from a small number of hectares; in the other we are happy if the yield is good enough.

What I've done.

  • Added postcodes to as many as 5,000 objects. (It's a little difficult to check as I have touched objects which already had postcodes).
  • Added around 1,200 different postcodes, about 20% of the city. (Again some may have already been present.)
  • Added around 5,800 housenumbers. These are not just retail premises, but houses close to shopping areas, and when I've walked along streets I've tried to add house numbers at intersecting streets.
  • Added over 2,500 buildings.
  • Taken 7,000 photos. Of which around 6000 are now available on OpenStreetView.
  • Recorded about 13 hours of mapping audio.
  • Loaded around 200 kilometers of GPX tracks.
What I've still to do.
  • Finish adding POIs for shops (particularly in the City Centre).
  • Indoor mapping in the two main Shopping Centres (Malls) in the middle of the city.
  • Finish adding building outlines in the retail landuse polygons (I'm tending to do smaller ones first)

Things I've learnt (and why)

  • Map all shops in a group together. If a single shop changes use or closes and the row of shops has been mapped it is often impossible to reconcile which shop has been affected. It's far better to be systematic for a small area than mapping patchily. Exceptions can be made for very recognisable buildings or POIs. (This also helps check that POIs are in the correct location, see below).
  • Open Data Addresses are great. The Open Data is not accurately geo-located (only to postcode), but it does contain the address. This meant that as long as I could locate the business on Bing aerials I did not need to collect detailed address data. This made surveying less arduous. 
  • Good high-quality building outlines help. A single building outline covering a whole block is useless. A lot of Nottingham City Centre had building polygons mapped not from aerial photography but from OSGB StreetView. Firstly the building outlines were not very accurate. Secondly, it is very time consuming to divide and correct such amorphous polygons.
  • Good photos and; decent aerial photos are critical. I have taken a huge number of photos (all available on OpenStreetView) to assist this mapping. I try and get photos of the roof line as I can correlate chimneys, dormer windows and other roof-line features between the aerial photos and my street level ones. It is amazingly easy to displace a POI a few tens of metres even with all this information.
  • Android Apps aren't much use in a City Centre. I made some use of KeyPadMapper3, but found the data often needed to be tweaked because my android phone GPS location wasn't too good. In the City Centre the canyon effect even with a Garmin is too much. A further reason not to use the phone is that I was already using a camera, two GPS (one in the backpack) and a digital voice recorder, juggling these and the phone was too much. The phone did come into it's own when the batteries ran out on the dictaphone. In the end I used the voice recorder for most addresses I collected. I didn't try Vespucci.
  • History of POIs is enormously helpful. Most of the errors in the Open Data are failures to update historical data (POIs closing, changing ownership, re-branding, or moving elsewhere). In many cases Nottingham mappers have kept the historical information when updating POIs, and this means that it's mush easier to reconcile OSM with the Local Open Data.
  • It's really difficult to tell if some POIs are still open. See the associated post on Vanishing Pubs.
  • Night-time surveying is the only way to check the status of some Bars, Nightclubs and Fast Food outlets. I'm too old to be a night owl, so someone else needs to do this.
  • POIs change fast. (Well I already knew this) My re-surveying of Market Street, Mansfield Road and Upper Parliament Street/Forman Street, which were all done 2 years ago by Paul Williams enables the rate of change to be quantified.
  • A 5% error rate in local government open data seems a reasonable assumption. This is not too different from rates found with NaPTAN and Ordnance Suryey Open Data Locator. It does mean that it's far better to use this data as the basis for survey (as we have done with Locator) rather than import (as was done with NaPTAN).
  • Local Government Open Data needs significant interpretation. It is collected for discrete purposes, and there is no integration across data sets. I presume licences are granted for a number of years. Therefore there are no checks as to whether the licence is still in use, or even has ever been used, until renewal time.
  • Extensive surveying is more fun, and less exhausting, than intensive surveying. By an intensive survey I mean one intended to collect all types of mapping data in a discrete area. Extensive surveying involves covering a larger area perhaps with some specific targets, but most information is collected as a side product rather than with deliberation.
  • It was a good mapping project. A targeted set of POIs makes for a reasonable mapping project over a shortish term.
  • More Systematic Coverage. Extensive surveying means more systematic coverage of the city: even if not in great detail.

What to do next

The next steps are fairly obvious. 

  • Repeat for Food Hygiene Data. I have an additional data source from the City Council which covers POIs which serve food (anything from fast food outlets to schools and hospitals). This is about twice the size of the Licensed Premises file (2400+ cf. 1200 POIs) and at the moment I have only reconciled 70% of the data. In the main this means checking more day nurseries, care homes and similar establishments.  

  • ncc_miss_fhrs_20130628
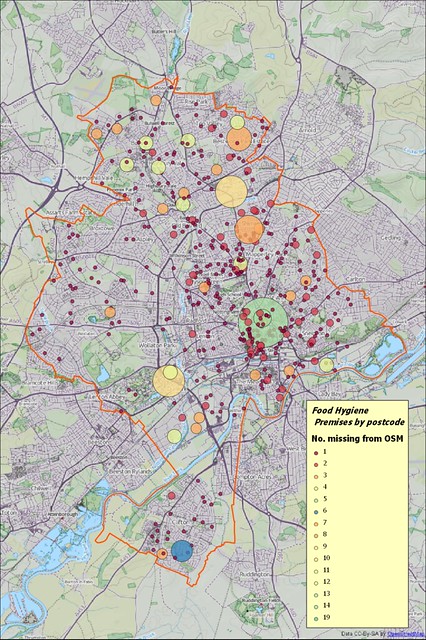
    Premises from Nottingham Open Data Food Hygiene file
    not reconciled with OpenStreetMap (cf. with image above).


  • Change Detection. Build a mechanism for automatically detecting change in the source data. So far I have just used a snapshot of the data, but it would be very useful to find changes in the source data files and use them to drive surveys.

  • Create additional tools for Food Hygiene data. The Food Hygiene data is actually available for many parts of the UK and is Open Data. There are at least 350,000 POIs available. It is usually safe to assume that it is accurate at the postcode level, but in the nature of retail outlets several are usual present in each postcode. It would be nice to be able to create layers for mapping (e.g., in JOSM, Potlatch etc) which spread the FHRS POIs out around their postcode location preferably ordered by housenumber in the right direction. It would also be good to be able to load subsets of this data as POIs or similar into Garmin or Android devices.

  • Developing sensible categories for retail. In some of the images in this blog post I have used an ad hoc categorisation of available amenity=* and shop=* values. It would be useful to develop a more considered version of these categories.

Conclusion

The most important thing is that this project would never have started without the availability of Local Government Data. Although I could have tried to find and map retail outlets I would have missed many isolated ones, and would have had no idea how many more there were to find.

With retail data mapped systematically it becomes possible to evaluate exactly how we use tags and if there are any obvious improvements. Remember that Nottingham is the 8th largest retail centre in the United Kingdom and is therefore a reasonable exemplar for all but the largest retail centres in Europe and North America.

A consequence of trying to be systematic is that I have visited areas of the city which have had very little on-the-ground mapping. I have been able to collect other POIs, addresses, correct road alignments etc.

Lastly, this is a very productive and rewarding means of mapping. If you have any local open data on shops I recommend a bit of Retail Therapy.

Thursday 27 June 2013

Cartograms and OpenStreet Map Data

Nham_maperitive_z13_cartogram
OpenStreetMap data distorted using a gridded cartogram based on Voronoi polygons from pub centroid locations.
Rendered with Maperitive.
Nham_mapnik_z13_original
The original OpenStreetMap data for the same area with Mapnik rendering.
I've been fascinated by cartograms ever since I was a child. I think the first one I ever saw was the one shown below.
Complete Atlas of the British Isles
Cartogram of Parliamentary Constituencies in the United Kingdom around 1960
from Reader's Digest Complete Atlas of Britain and Ireland (1965) p. 133.
Source: Unkee E. on Flickr.
Consequently the recent availability of a plugin for generating cartograms in Quantum GIS meant that I just had to fiddle around with it. Although I like cartograms I like even more to see the detailed mapping distorted in the same way as the cartogram. There are many famous cartoons exploiting a distorted view of the world to make both humourous and serious points. (I recommend the excellent book called Mental Maps by Peter Gould and Rodney White for many other examples).

View of USA from 9th Avenue, a well-known New Yorker cover cartoon.
Source: Wikimedia.
As is traditional in this blog my starting point was locations of pubs. Pubs are distributed very unevenly being concentrated in the city centre and along major roads. They are therefore a fairly good way of enlarging the centre of a city in a cartogram. The other virtue is that there are not too many pubs: early experiments with the cartogram plugin showed that I had to be conservative in the data I used.

My first step was to create Voronoi polygons from the nodes representing the pubs. This is a simple operation available in Quantum GIS. In this way every part of the area under consideration was assigned to a single pub. by assigning an arbitrary area constant to each polygon and using this as the driver of the cartogram plugin it is very easy to produce a basic cartogram.

Nottingham_Pub_Voronoi
Voronoi polygons for pubs in central Nottingham.
The outline of the road network is shown to provide a little context.

However, my main goal was to distort ALL the underlying OpenStreetMap data in line with the cartogram distortion. To do this I overlaid a regular grid of squares 200 m on the side over the pub Voronoi polygons. These grid squares were then merged with the pub polygons so that each polygon was split into many smaller ones. An arbitrary area value was calculated for each (as a percentage of the original pub polygon) and scaled so no value was less than 1 (to avoid the plugin crashing). Once again a cartogram was produced, but this time a number of the vertices had known starting co-ordinates arranged in a regular fashion. Each smaller polygon was uniquely identified by a compound key made from the pub polygon and the original grid square.

Nottingham_Pub_Voronoi_with_Grid
Gridded Voronoi polygons as above, but with a 200m square grid added.
Nottingham_Pub_VoronoiGrid_as_Cartogram
The basic cartogram derived from the gridded Voronoi polygons above.
Shading indicates all polygons corresponding to an individual pub.
With the basic cartograms created I imported them into PostGIS and then found the co-ordinates of all the vertices both in the original input data and the cartogram data. I filtered out only those co-ordinates which were at the vertices of the original grid squares and calculated simple X and Y offsets for each of these points. The offsets could then be applied to all points in the standard node table of an Osmosis snapshot schema. (I added a very simple interpolation of X and Y co-ordinates within each grid square as well). In practice I carried out all operations in the British National Grid (EPSG: 27700) and then converted back to WGS84 at the final step.

Finally I extracted the (distorted) data from my snapshot schema and stored it in the OSM XML format. To render the modified data I used Maperitive which is pretty much perfect for this purpose. The final result is shown at the head of this blog entry.

I leave it as an exercise  for the reader to find any useful purpose for this process!

Saturday 15 June 2013

Completeness of post box mapping in Britain

I'm always on the look-out for ways to visualise the degree of completeness of OpenStreetMap data. Although it's often possible to perform quantitative analysis, such as the work done by Peter Reed on supermarkets in the UK, it's usually a lot harder to show the geographic element, even when a comparative data set is available.

Thinking about this last night I realised that Geolytix's Postcode Sector open data would allow comparison between the list of post boxes released by the Royal Mail in 2009 and OpenStreetMap data. Although the Royal Mail data is not geocoded it does contain a reference for each postbox which includes the postal district  in which the box is located. OSM data can be directly matched to postal districts with a point within polygon query. The result is here:

OSM Postboxes by postal district
Percentage of Royal Mail postboxes mapped on OSM by Postal District

Note that the Royal Mail data is available as the result of a Freedom of Information request: copyright remains with the Royal Mail. I merely counted the number of rows in the tab-separated file for each postal district.

Producing the image took me way longer than I hoped. Reasons included bugs in QGIS regarding handling smallint and int columns from Postgres, a weird bug where the QGIS Print Composer refused to do anything sensible with a scale of 1:4,000,000, grappling with the new label formatter in QGIS, query performance; and adding attribution statements. In the end I did all the analytic processing in PostGIS and the presentation in QGIS. Accordingly I'm more interested than ever in the ideas of the guys at Mapsdata who I met a couple of weeks ago at a London OpenStreetMap gathering at the Blue Posts.

I hope the data speak for themselves. Very incomplete mapping in Wales, the South-West Peninsula, and Lincolnshire are no surprise, but I didn't expect the pretty good data in most areas of the Scottish Highlands. I suspect that much of this may down to the activities of a single mapper. A number of areas have more postboxes than recorded by Royal Mail in 2009: this may be redundant entries in OSM, single entries for post-box pairs in the Royal Mail data, or changes in the number of postboxes between 2009 and 2013.

Even in areas we know to be fairly well covered by on-the-ground mapping, coverage is patchy. I can only conclude that some mappers DO NOT MAP POSTBOXES.

Attribution ad absurdum

I drafted the post below a couple of years ago, but playing with some data derived from Ordnance Survey Open Data today and trying to mash it up with other open data sets with attribution requirements, reminded me that of what I'd written. I still think something is going to have to give with attribution and Open Data.

Caveat: I may have missed some references to things which were highly topical in April 2011, so bear this in mind when reading the main text.


Attribution is an odd thing : the benefits are intangible, but people care a lot about it.

In the narrow sense attribution is about meeting copyright terms, but in a broader view it is about giving due credit for data, ideas or other contributions. Government bodies often insist on it. Some industries take it to extravagant lengths: compare a film from the thirties with one made now. Attribution is also at the heart of the system of citations in scholarly papers, and which blights the lives of many students, but is well nigh essential for researchers.

It's also important for OpenStreetMap (OSM). OSM is both a consumer and producer of data requiring attribution. It is also a platform for generation and testing of ideas, processes and software. In the latter case a credit or acknowledgement is the only benefit that innovators might get: one of the reasons for the naked frustration in Mikel Maron's blog post about Google's activities in Africa.


Wednesday 5 June 2013

Vanishing Pubs

As I've surveyed shops in the past few weeks I've been completely amazed to see how many pubs have closed in the past 2-3 years. I wrote about mapping former pubs a couple of years ago.

Vernon Arms
The one that provided the initial idea for this post : Vernon Arms, now a Sainsbury's Local
This is a photographic selection of some I have encountered in Nottingham over the past few weeks, with a sprinkling of ones which closed long ago, but which I used to frequent. I've tried to be reasonably eclectic in my choice of pubs and their current uses, unfortunately I didn't realise that a Police Station was a former pub.