 |
| New Residential Roads in England and Wales Roads were identified from Land Registry Prices Paid data and matched by name to OSM highways within 2km of postcode centroid |
Thursday 26 December 2013
Assigning addresses from Land Registry Prices Paid data
After the disappointment of the Land Registry INSPIRE land parcels, it is nice to report a large and useful open dataset from the same source: the Prices Paid data (LRPP). These are the actual prices paid for houses and flats in England and Wales from late-1995 or thereabouts to the present.
Monday 23 December 2013
Mapping off-piste ski routes
The tragic death of a 16 year-old boy in Lech on Wednesday (18th December 2013), prompted me to look at aerial photos and various maps of the Arlberg area. As is usual with news reports of such accidents the information on the
precise locality is fairly sketchy. This is always annoying to anyone
who knows an area, and particularly if one goes off the marked pistes,
because detailed knowledge of the route and conditions are essential to
understanding the news. (Compare this with the volume of knowledgeable
and detailed commentary on cycling deaths in London).
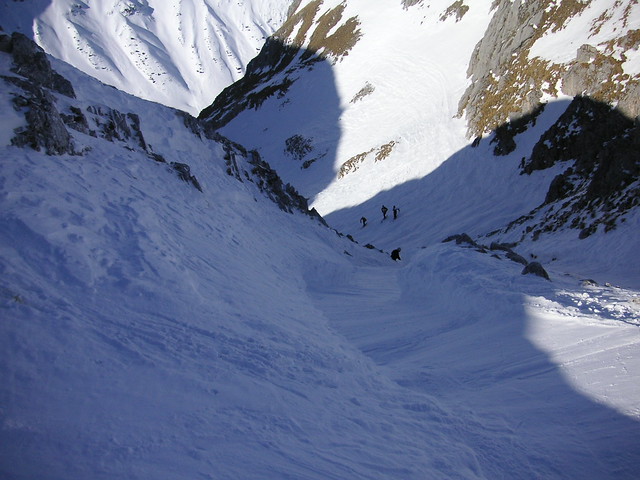
The boy was skiing with his father and his twin brother and a local ski guide. They started an avalanche which carried one of the boys, his father and the guide down the mountain around 150 metres. Fortunately the local news (understandably) provided a bit more detail: "Bereich Madloch-Fauler Stock Richtung Stierlochbach" and a photo of the avalanche.
The whole Arlberg area is well-known for a plethora of named off-piste ski routes, to quote "... every variant, however rarely skiable has a name...", so there was a good chance that this accident happened on a well-known run: particularly as it was so early in the season. As the avalanche debris fan was next to some Pinus mugo scrub the number of locations could be reduced. I own two books on Arlberg off-piste routes, but neither was to hand. I did find this fine photo with the main itineraries marked:
Details of the accident will be released by the Vorarlberg Avalanche service. These short accounts usually have an aerial photo giving an overview of the accident site, such as this one which was very wdely reported because it left a Dutch Prince in a coma from which he never recovered..
I mapped a little bit of the scrub on OpenStreetMap and also found this image of the entry to the Stierfall route. I suspect the the accident happened in either Heuwet or Heuwetrinne: both so frequently skied in mid-season to be heavily mogulled. None of these itineraries are mapped on OpenStreetMap, as is true for other itineraries throughout the Arlberg ski area.
In April 1992 I was lucky enough to have great weather in St Anton after an exceptional snowfall in March. Conditions meant that there was wonderful spring snow for a couple of hours in the morning, but everywhere routes which are rarely skiable were fully covered. It was astonishing to see ski tracks in the most unexpected places: particularly on the W side of the Arlberg pass between St Christoph and Stuben. Many of these routes were skiied long before mechanical uplift existed: nowadays the position of ski lifts determines which are favoured.
One of the odd things about this is to discover long vanished ski lifts. A post on Edward Tufte's forum alerted me to a website featuring Heinrich Berann's ski maps and panoramas. (Berann may be familiar to others as the illustrator / cartographer of Ocean Floor maps). Berann's style is very recognisable.
What is particularly interesting is that he made ski 'maps' for the Arlberg area from 1937 through to the late 1970s, and therefore it is possible to trace some of the evolution of the area's infrastructure. Most noticeable is that until around 1980 there was a lift on the W side of the Arlberg road at St Christoph. Also noticeable is the curious way the grading of ski runs has changed: particularly true of runs now classed as freeride. Runs which were once just graded as black turned into ski itineraries, and some have just disappeared.
Of course someone has thought of mapping freeride territory: Freeridemaps of Altstätten, Switzerland. The sample image on their website is the Arlberg area around St Anton-am-Arlberg. In the main the map shows areas appropriateness for different ranges of skill and experience: but as far as I can tell largely based on objective factors, such as safety of run-outs, and likely consequences of a fall. Above all it is based on the steepness of the land.
The Swiss and Austrian avalanche service also produce map overlays based on steepness to show avalanche risk: in the Swiss case this data is available by subscription in the White Risk app for Android and the iPhone.
Mapping avalanche risk on it's own is a challenge. There are numerous different factors to represent: altitude, age and depth of snow pack, recent changes to snow pack, aspect, underlying terrain (steep grass slopes often avalanche). In writing this post I came across some interesting papers on the subject of the cartography of avalanche maps.
One of the more intriguing ideas is how the history of the snowpack at a point can be displayed (see above). Quite how such data might be transformed to convey information on a map is beyond me.
Despite the great advances made in the past year with OpenSnowMap there is considerably more which we could do to provide information relevant to freeride and back-country skiing, and ski mountaineering.
The boy was skiing with his father and his twin brother and a local ski guide. They started an avalanche which carried one of the boys, his father and the guide down the mountain around 150 metres. Fortunately the local news (understandably) provided a bit more detail: "Bereich Madloch-Fauler Stock Richtung Stierlochbach" and a photo of the avalanche.
The area NW of Madlochjoch on OpenSnowMap (View Larger Map)
(close the overlay to see the map)
(close the overlay to see the map)
The whole Arlberg area is well-known for a plethora of named off-piste ski routes, to quote "... every variant, however rarely skiable has a name...", so there was a good chance that this accident happened on a well-known run: particularly as it was so early in the season. As the avalanche debris fan was next to some Pinus mugo scrub the number of locations could be reduced. I own two books on Arlberg off-piste routes, but neither was to hand. I did find this fine photo with the main itineraries marked:
 |
| Overview of off piste routes accessible from Madlochjoch ((c) Author: Roland Wasmayer, Source: freeskiers.net via OutdoorActive) |
I mapped a little bit of the scrub on OpenStreetMap and also found this image of the entry to the Stierfall route. I suspect the the accident happened in either Heuwet or Heuwetrinne: both so frequently skied in mid-season to be heavily mogulled. None of these itineraries are mapped on OpenStreetMap, as is true for other itineraries throughout the Arlberg ski area.
 |
| Entering the Stierfall, photo Stegaku |
One of the odd things about this is to discover long vanished ski lifts. A post on Edward Tufte's forum alerted me to a website featuring Heinrich Berann's ski maps and panoramas. (Berann may be familiar to others as the illustrator / cartographer of Ocean Floor maps). Berann's style is very recognisable.
 |
| Ski map of St Anton-am-Arlberg by Prof H.C. Brann |
What is particularly interesting is that he made ski 'maps' for the Arlberg area from 1937 through to the late 1970s, and therefore it is possible to trace some of the evolution of the area's infrastructure. Most noticeable is that until around 1980 there was a lift on the W side of the Arlberg road at St Christoph. Also noticeable is the curious way the grading of ski runs has changed: particularly true of runs now classed as freeride. Runs which were once just graded as black turned into ski itineraries, and some have just disappeared.
Of course someone has thought of mapping freeride territory: Freeridemaps of Altstätten, Switzerland. The sample image on their website is the Arlberg area around St Anton-am-Arlberg. In the main the map shows areas appropriateness for different ranges of skill and experience: but as far as I can tell largely based on objective factors, such as safety of run-outs, and likely consequences of a fall. Above all it is based on the steepness of the land.
The Swiss and Austrian avalanche service also produce map overlays based on steepness to show avalanche risk: in the Swiss case this data is available by subscription in the White Risk app for Android and the iPhone.
Mapping avalanche risk on it's own is a challenge. There are numerous different factors to represent: altitude, age and depth of snow pack, recent changes to snow pack, aspect, underlying terrain (steep grass slopes often avalanche). In writing this post I came across some interesting papers on the subject of the cartography of avalanche maps.
| Profile of Snowpack derived using DAVOS ELF SNOWPACK program |
Despite the great advances made in the past year with OpenSnowMap there is considerably more which we could do to provide information relevant to freeride and back-country skiing, and ski mountaineering.
- Grading. In my view the current use of a single category of freeride downhill routes is misleading, Many off-piste guides such as those for the major French resorts published by Editions Vamos, or the similar Polvere Rosa covering the south side of the Monte Rosa massif, make use of grading schemes (4 classes of technical difficult in the former, 7 in the latter which includes some extreme itineraries; and 4 classes of objective dangers). I am hesitant to mark freeride areas which I know because of the wide range of difficulties and objective dangers likely to be encountered.
- Routes. To a certain extent showing routes spoils some of the key aspects of being away from the piste. Picking ones own line, both in the light of one's ability and safety of surroundings is part and parcel of developing the skills and awareness necessary. In many places (Albona at Stuben, most of Les Grands Montets below 2800m, Pavi in A-basin) all that is needed is to show that the area is free-ride territory. In others entry lines and exit routes may not be immediately obvious and are worth showing (it is not uncommon for these to be the least pleasant part of a route), particularly if there are cliffs or other hazards lower down (e.g., above Le Fornet, Val d'Isere).
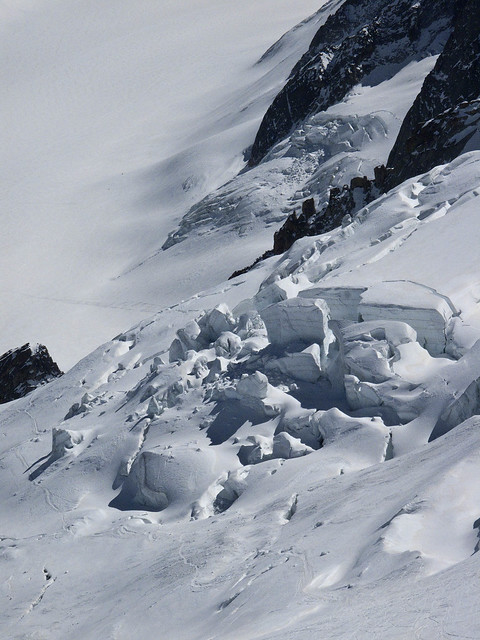
Seracs on Glacier des Rognons, Les Grand Montets by LensScaper, on Flickr
IGN Geoportail shows what's underneath the snow.
- Objective Hazards. If more freeride terrain is to be added to OpenStreetMap there needs to be much more mapping of the obvious objective hazards: cliffs as mentioned above are the prime example. Others might include: streams (which may not be frozen enough to bear loads), known crevasse and serac fields (mapping individual crevasses can wait a while), 'bullet-proof' ice on glaciers, and notorious avalanche gullies.
- Safety. Obviously marking ski routes creates some concerns over people placing too much reliance on such information. In reality people undertaking such routes require a minimum level of skill, equipment, knowledge and experience.
Note: This post contains a number of images which are copyright by their respective authors, and are not licensed under creative commons. Normally I try and only use CC images, but in this case suitable images were not available. Please respect the rights of the image owners.
Monday 9 December 2013
building=collapsed : history of an OpenStreetMap tag
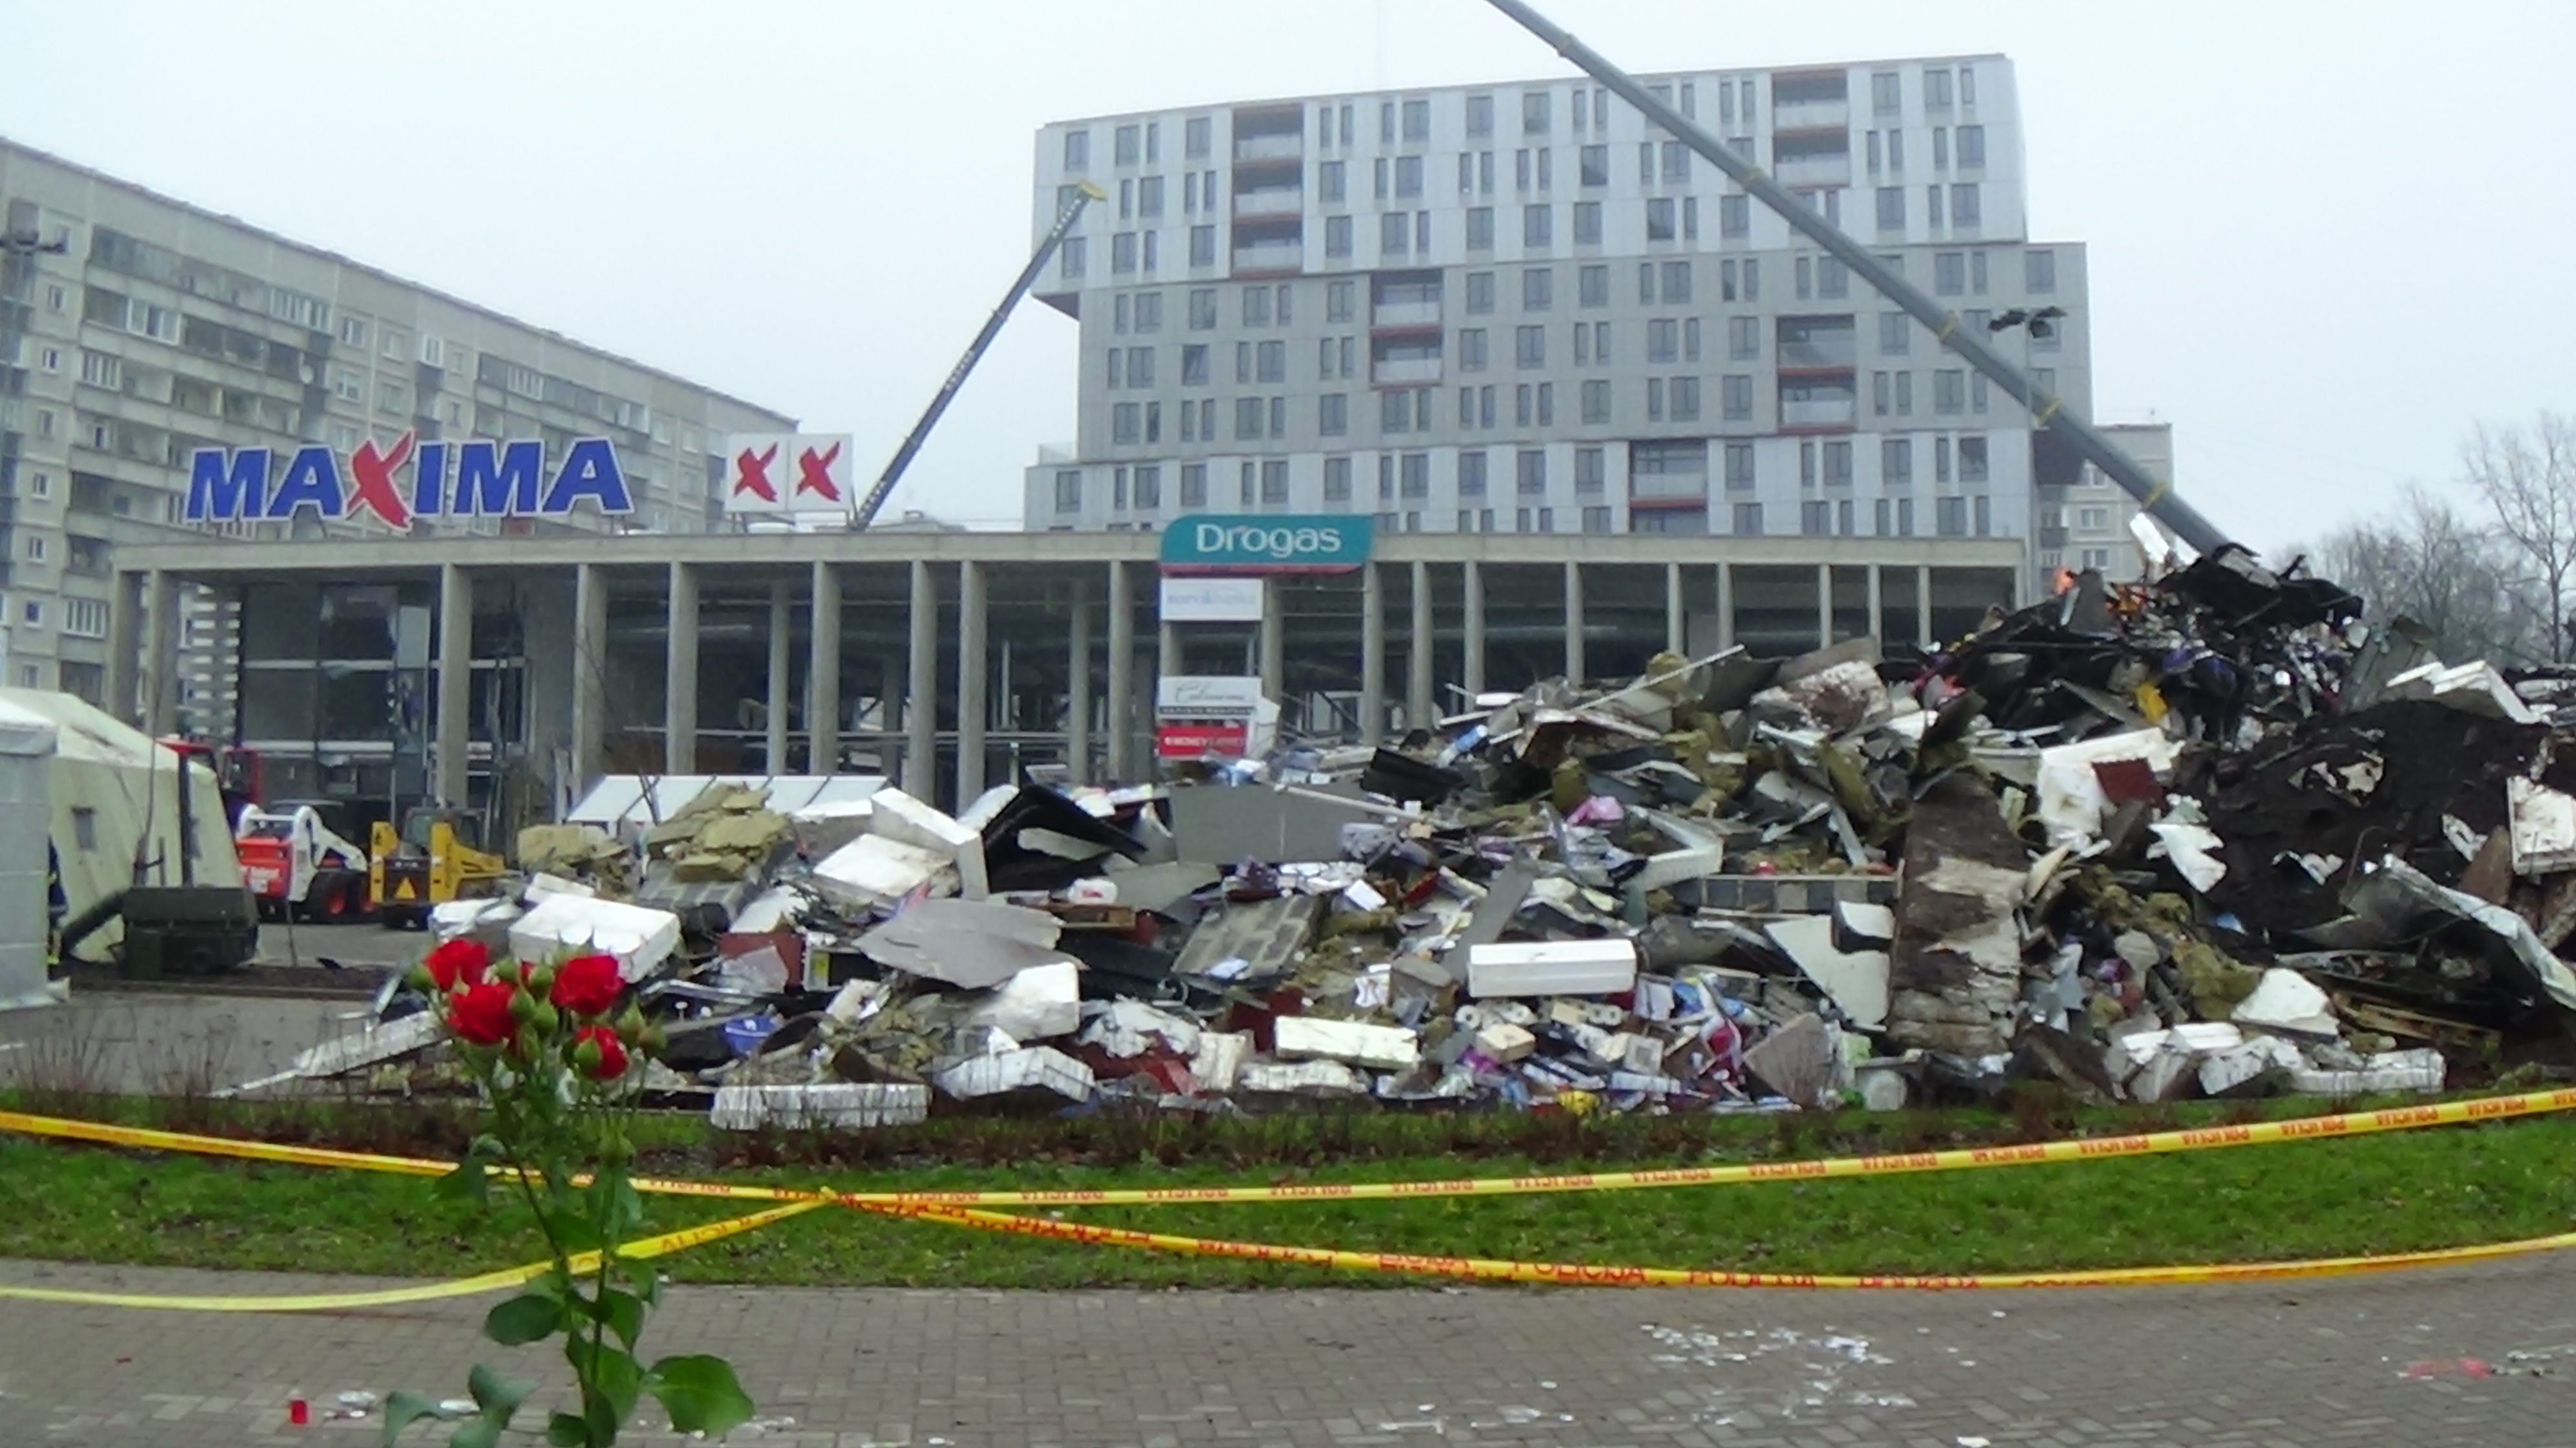 |
| The collapsed Maxima XX Supermarket in Riga Source: Valenciano via Wikimedia Commons. CC-BY_SA |
There are a number of other recent instances where the badly damaged buidlings' changed circumstances have been mapped very promptly on OpenStreetMap. Notable example are: The Clutha Vaults, hit by a helicopter in Glasgow and the collapse of the roof of the Maxima XX supermarket in Riga.
The normal changes are to either remove any amenity tags (usually by pre-pending them with old_, which facilitates finding the location), mark the surrounding area with landuse=demolition, or landuse=construction, and to change any building=* to building=collapsed. The process now occurs as swiftly as the creation of the associated article on Wikipedia: naturally there is substantial synergy between the two processes.
However, the building=collapsed tag did not evolve in order to better illustrate news events.
 |
| Presidential Palace, Port-au-Prince after 2010 earthquake. Source: Wikimedia Commons CC-BY-SA. |
 | |
| Central Port-au-Prince showing collapsed and damaged buildings, 17 January 2010 The Presidential Palace is top right. Source: Haiti Earthquake Damage Map |
However, over time, OpenStreetMap's capabilities and credibility have increased. One factor is that after a major disaster OSM can deploy a significant number of mappers who already have experience of interpreting aerial imagery after catastrophes. Another, as in the Philippines recently, first responders, such as the Red Cross, are seeking to use OSM directly.
Most of these entities have been mapped very recently as part of the concerted effort to provide high quality maps for humanitarian relief efforts for Typhoon (Yolanda) in the Philippines.
 |
| Collapsing house, Babbacombe © Copyright Derek Harper and licensed for reuse under this Creative Commons Licence. |
For me these are the significant points:
- Simplicity prevailed over exactitude in the tagging. We still don't cleanly separate building type and status. This is not just because the simple tag is much easier to remember and apply: reusing an existing tag often means that downstream data consumers require little change to meet the particular humanitarian situation. An additional tag for building status would have required a whole host of changes to allow simple maps to be rendered. Using building=collapsed meant that one rule needed to be added and maps (see image above) were being produced within hours of the tag going into use.
- Tags for major disasters often reflect things which happen anyway, but which in the normal course of things are unusual. Buildings collapse from time to time: from storm damage, after fires, from structural defects and so on. It's just that for those of us living in North America and Europe these are relatively rare events.
The advantage of a worldwide database is that, however rare certain events are locally, they will be happening somewhere and if there is a mapper there they will want to know how to tag it. Although in this case the tag was created by armchair mappers. I'm sure that there are plenty of tags already in use for particular situations somewhere in the world which would fix tagging problems in my local patch.
- Tags persist. Once a tag enters widespread usage it is very hard to kill. The OSM wiki is full of deprecated tags, XXX 2.0 schemas etc. However well-intentioned these ideas just don't match how tagging works in practice. Despite 3 years of advocacy of detailed tagging guidelines for public transport we still have plenty of highway=bus_stop tags. (More on this type of problem anon).
Sunday 8 December 2013
Food Hygiene Open Data : an easy way into mapping addresses and postcodes
I've written a bit about the Food Safety Agency's Food Hygiene Open Data (henceforward FHRS) before, but as it was the focus of my hacking at last weeks London Hack Weekend, it's about time it had a dedicated post.
To recap the salient points about FHRS data are:
 |
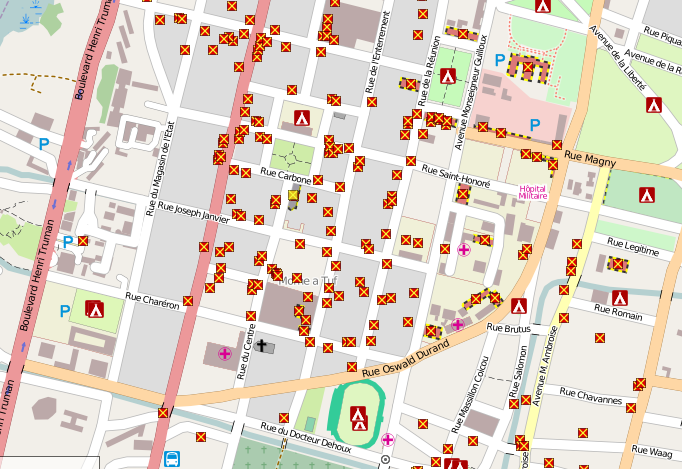
| FHRS premises spread out along a line normal to shortest line to associated street (See article for details) Data (c) from OSM contributors 2013, and Food Hygiene Rating Scheme (OGL) |
To recap the salient points about FHRS data are:
- It's pretty comprehensive, covering most local authorities in the UK.
- It represents more than 15% of all postcodes.
- Most records come with full address data and a location (the postcode centroid).
- Premises (shops, pubs, cafes etc.,) are grouped into categories which map fairly easily to OSM tags.
- Daily updates. High data currency (last reviewed date on all records).
- It's Open Data under the plain vanilla Open Government Licence.
Wednesday 4 December 2013
British Postcodes on OpenStreetMap
British contributors to OpenStreetMap are known for an apparently unhealthy obsession with postcodes.
We are not alone in Britain: there are many groups who need access to postcode data. This is because postcodes in the United Kingdom provide an excellent proxy for geolocation, and as such are widely used: in SatNavs; for geodemographics (such as Acorn, Mosaic, and the (open) ONS Output Area Classfication ); in a host of analytic applications, as well as their more prosaic role in delivering the post. In 2010 postcode centroids were made available through the Ordnance Survey Open Data scheme, under the brand CodePoint Open. Subsequently it was found that the license associated with this data prevented it being used directly in OSM. More recently the Office of National Statistics have released an (identical) data set which is not encumbered by the license of CodePoint Open.
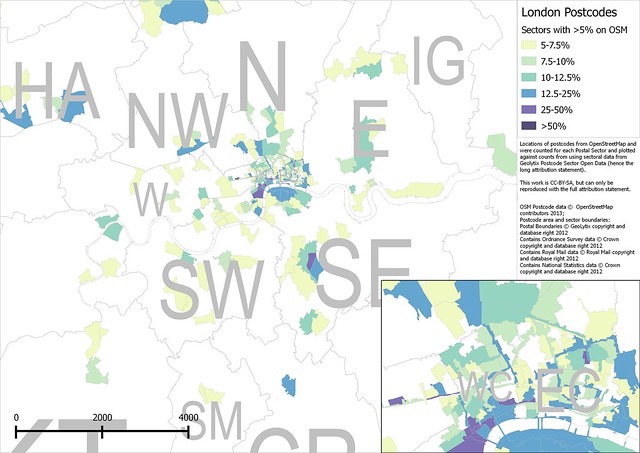 |
| London Postcode Sectors with more than 5% of regular postcodes mapped on OpenStreetMap. See image for copyright notices. All completeness percentages are shown below. |
Monday 2 December 2013
Harry we missed you! London OSM Hack Weekend
 |
| Thura (half out of picture, sorry), Dan, Matt and Shaun do a "Harry" |
 |
| Andrew, Thura, Dan, Matt, Shaun, Grant, Serge, Mick, me (standing), Jon (photo Simon, Cyclestreets) |
- The major thing that was done on the Saturday was updating the main OSM website: most OSM users should have noticed these changes by now. Not everyone is happy (although this is a given for any change on the OSM site), and following SomeoneElse's comments about the browse pages I have to agree with him that giving the map more space reduces the usefulness of these pages. However, I am equally sure that most glitches will get ironed out quite quickly.
- Dan worked on getting offline maps running on Firefox phones. (Several of us were interested in Dan's digitizing tablet too).
- Dan, and perhaps others, did some work on the HOT OSM Tasking Manager.
- Frederik brought a case of Club Mate along. To my surprise I found it quite palatable.
- Half of OSM London are getting married next year. Congratulations to Shaun and Andrea, Harry and Francine, & Derick and Morag.
- Simon, Shaun and I had a long chat about whether OSM can be used for sensible multi-modal transport planning.
- Robert was working on That Shouldn't be Possible, his nifty tool for finding bad map data by comparing OSM data with real GPS traces of routes.
- Serge, Robert, Grant and I had a passionate, but I hope, good-natured, debate about the FDA requirement that 23andMe's DNA sequence kits need to be licensed. I plan to blog about genetics, open data, big data and related topics real soon now: it was an opportunity to rehearse some of my arguments.
- Kat Arney - embryologist, science communicator, journalist, harpist, and knitter - was around on Saturday morning. She interviewed most of us: so one or two of the more coherent statements may appear on a BBC Radio programme in the New Year. Her parting shot when the pizza arrived was that we lived up to all the stereotypes of hackers! (Male, Club Mate drinking, pizza eaters.)
 |
| Food Hygiene postcodes buffered to 100m matched to OSM named highways. (Note NG8 2AE which does not find any highways). (Image contains copyright Ordnance Survey, Royal Mail and OpenStreetMap open data) |
- MickO and I made a start on working with Food Hygiene Open Data. Mick wrote a parser for the XML and then generated a shape file from a subset of the data. I (eventually) managed to match FHRS postcodes to CodePoint Open postcodes and then find all OSM streets within 100 metres. Mick tried inputing the FHRS data into Nominatim, but for some reason Nominatim won't match the full addresses from FHRS. (I regard this dataset as an excellent exemplar for trying out a host of issues with fuzzy matching of OSM data to external data and conflation).
- A wikipedian, whose name I didn't catch, visited late on Sunday afternoon. Like Kat, who has written a chapter about my former boss in a forthcoming book, he has been involved in improving the coverage of the work of female scientists in public media. (Wikipedia have an initiative and a lot of work was done recently on Ada Lovelace day). He wanted advice on what information he could collect and in particular about geotagging photos.
Thursday 31 October 2013
Not very INSPIREd: Land Registry 'Open' Data
Many OpenStreetMap contributors have been very excited about the potential for importing address information from data sets released under the European Union's INSPIRE directive. Our experience in the UK tends to make us more cautious in our expectations, and so it proved with the latest release of Open Government Data under this programme.
Firstly, (another) quick word about the complexities of organisation of cadastral data in the UK. There are separate cadastral agencies for each of England and Wales, Scotland, and Northern Ireland (note the Oxford comma), which run in different ways: not least because the legal framework of Scot's Law is quite different from English Law. Thus the data released only relates to England and Wales.
Comparison of Land Registry parcels with gardens on OSM in Sutton Coldfield
Scatter plot with log-log scale.

Wednesday 2 October 2013
OpenStreetMap at a Public Inquiry
Summary (tl;dr)
OpenStreetMap featured in a Public Inquiry about whether a particular route was a Public Right of Way (PRoW). I appeared as a witness at this Inquiry for Paul Sladen (another OSMer) regarding how it has been mapped on OSM. This post describes the unusual circumstances as to why the status of Lenton Road path is controversial, a bit about the history of the path, details of my statement and the hearing, and a little bit about other uses of OSM in official planning processes.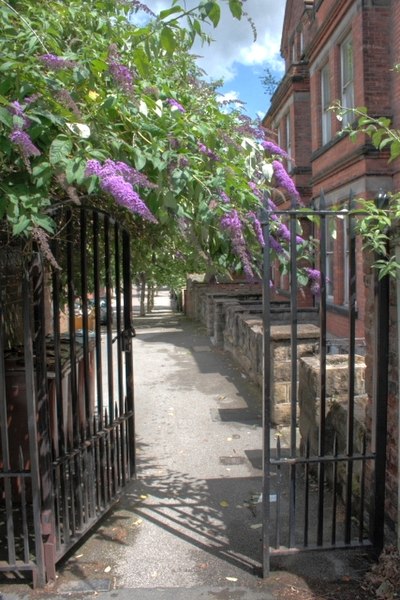 |
| Gate at the Lenton end of Lenton Road. The installation of this gate and later locking of the gate at night time was one of the sources of disagreement about the status of the footpath. Source: Mick Garratt on Geograph via Wikimedia Commons |
Thursday 19 September 2013
Mapping Kiosks : an exploration of some tagging issues
 |
| Kiosk on Patmos, source Wikimedia Commons |
 |
| Typical newsagent kiosk, selling papers, magazines, periodicals, soft drinks etc. Plaza de San Juan, Caceres, Extremadura, Spain. Source: the author, CC-BY-SA |
Given the widespread familiarity of these in Europe, and the equally widespread use of the term kiosk to describe them (in Switzerland, the ones run by Valora are just branded K Kiosk), it was perhaps inevitable that these have been tagged shop=kiosk. Given the sheer profusion of them in Tallinn and Riga it is no surprise to find 35,000+ mapped across the world on OSM.
However there is a problem. "Kiosk" is most commonly used in English to refer not to the category of goods sold in the shop, but to the kind of retail outlet. So a kiosk can generally be recognised as a place where goods (or services) are sold through a hatch, or over a counter; and where there is no entrance for customers. We talk about ticket kiosks, information kiosks, boat-hire kiosks, etc. Frequently fast food is sold from kiosks. Other common usages are for shoe-repair, and key-cutting. The little retail units in the middle of the wide aisles of shopping centres (malls) are also called kiosks, at least in the trade (sometimes also 'pop-ups', I'm told). So far I have found these selling: mobile phones, sunglasses, ice cream, nail grooming, back-massage, jewellery, sweets, and so on.
I've raised this before on OSM Help, but visiting the Baltic States meant that I had an extra incentive to notice retail outlets conforming to the more general notion of kiosk. This turned out to be quite easy. There is a well-known place to buy flowers on the edge of the Old City of Tallinn, . It turns out that this is a long row of florists kiosks. (There are one or two other types of businesses as well: an exchange bureau and a tobacconist).
 |
| Row of florist kiosks in Tallinn |
Similarly, there are plenty of places where the shop=kiosk is not in a kiosk but is a regular shop with a door, customer-accessible shelves allowing browsing of products, and a counter well inside the shop. The ones I encountered were mainly in bus stations, notably those in Tartu and Tallinn, but they are also to be found in the cities themselves, for instance this one (mapped as shop=convenience, but much closer in product range to a newsagent/kiosk) on the edge of the remarkable Art Nouveau quarter of Riga.
Apart from just wishing to map kiosk-type outlets as part of achieving comprehensive coverage of retail outlets, the issues raised by the current tagging are widespread and generic. The rest of this post is concerned with some of these. Unfortunately I don't have any good answers as to how to deal with these problems, but by backtracking from the specific to the general want to start a discussion which is not laden with the oddly emotive discourse that characterises tag-specific discussions.
So in no particular order here are the things which struck me in considering the issues raised by the shop=kiosk tag.
Synonymy of Kiosk and Newsagent
Using the chance to check a range of kiosks in both Latvia and Estonia confirmed what I had always suspected that the shop=kiosk tag is synonymous with shop=newsagent. Newsagent is the standard way of describing shops which sell the same range of goods, indeed, they are known in retail and marketing parlance as CTNs (Confectioner, Tobacco, News). It's noticeable that we have many fewer in Britain now. Most local newsagents have become general convenience stores, to the extent that it is quite surprising to find a typical newsagent outside of city centres and transport hubs.There is no real problem with having synonymy of tags in OSM, despite frequent arguments that consistency is important, the added cost of adding shop in ('kiosk','newsagent') instead of shop='kiosk' in post-processing is very small. Given that newsagent is used about ten times less frequently, it might be argued that we should replace all shop=newsagent with shop=kiosk. In general mass replacement of tags is nearly always a bad idea (see below, semantic degradation), and in this case is certainly likely to result in substantial confusion for those mappers who are not familiar with the European usage of kiosk. (A further complication is that mass replacement of tags has inevitably become associated with individuals doing such edits without asking anyone else, and certainly not achieving consensus).
Semantic Degradation
The worst thing that could happen is to degrade the meaning of shop=kiosk.At present it has a precise readily understood meaning for most areas where it has been used by mappers (and even an elegant icon on MapsWithMe). If we were to use shop=kiosk for other types of retailers operating from kiosks we inevitably render both terms largely meaningless, particularly as shop=kiosk has been applied to newsagents operating from regular shops.
 | |
| Lottery Kiosk,St. Helier, Jersey Source: Wikimedia Commons |
I often notice that people advocating changing tags on the wiki seem to be oblivious to the inevitable risk of reducing the meaning of the tag. Most of the seriously egregious examples I can think of come from imports in the USA: place=hamlet for inner-city industrial districts, landuse=forest for places operated or administered by the Forest Service — I hope for consistency's sake they also mapped the HQ in Washington DC in the same way — and a number of others. Of course when done in an import it is worse because it can even distort worldwide statistics on tag usage (as displayed on taginfo).
Not Mapping (or not Tagging)
Sometimes the alternative seems to be not to map the object because no tag fits, or to map it, but avoid detailed tagging (e.g., as a generic building, perhaps with a name).A typology of tagging issues
An inevitable reaction by mappers is to take tag keys and values too literally. Often a key=value combination was chosen to map a specific limited class of objects, a good example is highway=milepost. In Britain, the States, and in the Roman Empire there are or were mileposts. In most of the rest of the world (and on British Motorways) distances are marked in kilometres. A more general name for the value such as distance_marker would have avoided some of the oddities surrounding use of this tag. |
| Boat Hire kiosk Source: Sarah Smith on Geograph via Wikimedia Commons |
The other type of problem which ideally we would avoid are potential 'false-friends', 'faux amis' etc. An excellent example here is the simple word alley, which at one stage was confused with Allee (an avenue) for tagging trees, and even usage in English varies from place to place (for instance, I think of alleys as very narrow roads or paths (see Twitchell), whereas in many places these are roads which provide service access to the rear of properties).
 |
| ONCE Lottery kiosk, Caceres, Spain |
Here are some of the reasons that I've come across which explain tags might not be as useful as they could be (or 'borked' according to IRC users):
- Firstly people often assume their tagging use-case is very distinctive, without realising there are likely to be similar cases elsewhere in the world. They then fail to consider the general implications.
(I learnt this lesson many years ago when trying to analyse information needs for hospital managers across the EU. The UK hospital where I started data collection was in the East End of London and had problems with translators for the high proportion of Bengali speakers amongst their patients. I cited this as an example of a very specific problem to a Dutch colleague, only to learn that similar problems existed in hospitals in Amsterdam. 20 years later this is a common issue for healthcare across Europe.)
- Secondly, often a mapper will want to capture enough detail while the survey was fresh. They might not find tags which are already in use, and create new ones, sometimes merely as place-holders, with a view to updating to something more widely used later. After a while these 'of-the-minute' tags take a life of their own. One I use is shop=money for the widespread pay-day loan outlets: it's convenient, and memorable, but I've never checked the wiki or taginfo to see if anyone else uses it.
- Thirdly, the existing tag might have a perfectly sensible value, but the value is not as accessible compared with obvious synonyms. A couple of examples where alternatives might be quicker and more immediately accessible for non-English speakers: shop=cake, shop=pastry and shop=sweet do similar jobs to shop=confectionery; a shop repairing shoes could be shop=cobbler or shop=shoe_repair; and shop=betting is more obvious than shop=bookmaker.
- Fourthly, tags can be loaded with cultural assumptions. amenity=churchyard, obviously doesn't work for the precinct of a mosque or a Hindu temple, or a synagogue, and isn't particularly appropriate for the surroundings of a Quaker Meeting House. In this case it's not obvious whether we have a viable more general alternative, or even that such an alternative is desirable as it would require tagging with religion=* and possibly denomination=*.
 |
| Kiosks can have architectural merit as buildings in their own right. Newspaper kiosk, Christiania 1897, designed by architect Jørgen Haslef Berner. Now at the Norsk Folkemuseum, Oslo Source: Wikimedia Commons. |
 |
| Typical ticket and literature kiosk, Linn Botanic Gardens, Cove, Argyll and Bute |
Other kinds of small retail outlets
Kiosks are just one kind of the set of smaller retail outlets. If we aspire to be able to capture the retail activity of a city (which I certainly do) we need to be able to map these and a few other non-shop outlets: |
| 'Kiosk' in a Shopping Centre Source: Wikimedia Commons |
- Stalls, typically on a market, but also common in tourist areas selling crafts. Stalls may be occupied every day, as at Cambridge Market, or only occupied at certain times of the week, such as the market on Helvetiaplatz in Zurich. The basic difference between a kiosk and a stall is that goods cannot be left overnight on a stall. Moveable huts, such as those often used at Christmas Markets represent a kind of half-way house. The stall holders at the Helvetiaplatz market are sufficiently regular as to be listed on a website. (Market Stalls in permanent covered markets are often smalls shops or meet the broader kiosk concept).
- Pitches. Street-traders are not so common in Western Europe these days, but are plentiful elsewhere in the world. In Nottingham there used to be a lady who sold fruit from next to a taxi rank: I've never felt her goods were terribly appealing as she was always dripping cigarette ash over them. These locations are usually regulated and licensed in Europe, and even when such regulation does not exist traders will maintain traditional locations. Most of these in Europe probably sell fast food and are already covered by use of the amenity=fast_food, such as this Roast Chestnut seller at the Stauffacher tram stop in Zurich.
 |
| Mobile street vendor (ice cream & soft drinks) at a pitch. Central Park, New York. Source: Wikimedia Commons. |
Conclusions
OpenStreetMap is remarkably good at step-wise refinement of most of the things it deals with: areal extent of coverage, depth of coverage, detail of coverage, accuracy of coverage,and (even) documentation. Tagging is the one area where we have never developed widespread, sensible and commonly used methods to improve on what we started with. Often when a "2.0" tagging scheme is proposed it does things in a very different way from the original scheme, and often that way is much more complicated (see Public Transport schema, and Healthcare 2.0 on the wiki). This is not iterative refinement as I would understand it:
As I stated at the outset, I have no solutions to this problem, but the more I look at it, the more I think that it is significant. The real problem is that we potentially have the tools but what we lack is any mechanism within the total OSM community (i.e., any one who maps and tool providers) to agree that a) a tag is 'borked' (example from last night on IRC barrier=entrance, or even barrier generally); and b) agree what it's replacement should be. On the other hand this seems much less complex than the ODbL process, so I think we'll find a way eventually.
In the meantime, I'm going to assiduously collect examples of kiosks selling all kinds of stuff, and play around with tagging these until I find something which seems to work well.
Tuesday 17 September 2013
A quartet of Botanical Gardens
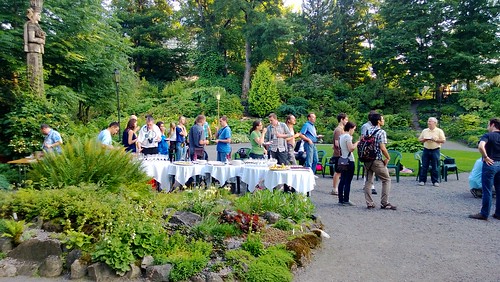 |
| Evening food and drink in Tartu University Botanical Garden, SotM Baltics 2013 |
In recent years I have started visiting botanical gardens, not just because they are attractive places, but to look at particular groups of plants in detail. Often they have collections of local native plants which might be hard to see or find in the wild, and they may have other collections which reflect local environmental conditions or academic interests. These places also often have a great deal of historical interest, and often reflect aspects of a country's culture which aren't otherwise apparent to the casual visitor. (François Mitterrand is alleged to have changed his less-than-high opinion of the British after visiting Kew Gardens, but then he was also fascinated by Margaret Thatcher's ankles).
Thursday 22 August 2013
PfAFing About : opening UK address data
 |
| The Postcode Address File doesn't work all the time. |
RT @drbobbarr: URGENT If you don't want to be charged 4 UK addresses and postcodes forever don't let PAF monopoly be privatised. #OpenPAFnow
— Tim Berners-Lee (@timberners_lee) March 21, 2013
Postcode address file (PAF) to remain as state monopoly bit.ly/11naOao. The value destruction of PAF starts here...
— Jonathan Raper (@MadProf) April 22, 2013
Everyone's postcodes to be privatised in Royal Mail flotation, despite objections from Sir Tim Berners-Lee: Telegraph soa.li/Gt75z0dNaturally this has led to discussion on twitter as to whether one can create a fully open alternative to PAF.
— Robert Barr (@DrBobBarr) April 19, 2013
The rest of this post is probably mainly of interest to mappers and OpenData advocates in the UK. To the outside world UK OpenStreetMappers seem to be oddly obsessed with postcodes. I hope some of the reasons for this may become apparent from this post.
Tuesday 13 August 2013
History Workshop at SotmBaltics
On the Sunday morning of the State of the Maps Baltics Susanna Ånäs had organised a workshop on mapping historical geographies.
 |
| Getting the History mapping workshop underway Senate Room, University Main Building, Tartu |
Saturday 10 August 2013
Cats in Riga
 |
| Knitted Cats on stall in Egle Craft Market, Riga |
@SK53onOSM Hi! If you encounter the souvenir in the photo, could you please bring two of it? Also, a 2 Lat coin :) pic.twitter.com/bSchGuwN8a
— Ilya Zverev (@ilyazver) August 1, 2013
Unfortunately the message arrived too late. Knowing the fondness for cats of many OSMers in Eastern Europe I thought I'd check a few souvenir shops in Riga on my return. I didn't know of Riga's association with cats, especially black ones, but soon found out.
 |
| Latvian folk-beliefs about cats from sign on Craft Stall (Egle) |
 |
| Detail of Laba Kompanija / Good Company by Andra Kurzemniece Exhibition of textile art, St. Peter's Church, Riga |
 |
| Park Cat |
 |
| Souvenir Cat (outside shop which sells wooden cats seen above) |
 |
| Street Cat |
 |
| House Cat |
 |
| Hotel Cat |
 |
| Cat House |
 |
| Fed Cat |
Wednesday 24 July 2013
Persistence in the Urban Environment : 2 Portland Oregon Buildings and experimental clustering
 |
| Areas of the Mutlnomah County, Oregon grouped into 5 clusters based on patterns of building age. Each building is plotted individually using the colour assigned to its own cluster. (data from City of Portland Open Data Initiative, background OSM) |
My basic idea was to do something along the following lines:
- Partition the buildings into contiguous equal sized groups
- Create some kind of time-series for each group reflecting building history
- Run a clustering algorithm against the latter data
- See if it produced interesting results
Monday 8 July 2013
June Nottingham OpenStreetMap Pub meet-up
 |
| A mix of late 19th/early 20th century terraced houses on Foxhall Street, Forest Fields, Nottingham. At the S end there are substantial villas near The Forest itself. |
After a hiatus of two years I decided it was time for another pub meet-up in Nottingham.
We followed the formula from the past: an hour of mapping before adjourning to the pub. I've set dates for the next few months: the next meeting is on Tuesday 9th July.
Here's what we got up to in June.
Friday 28 June 2013
The Shopping News: mapping retail outlets in Nottingham
Nottingham Open Data 6
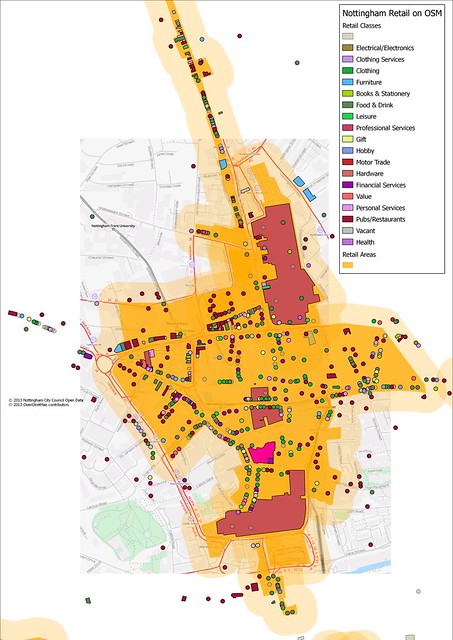 |
| Nottingham City Centre retail areas with mapped retail units (shops, banks, pubs, restaurants, cafes, fast food outlets etc.; the large areas are shop=mall (an unsatisfactory tag)). |
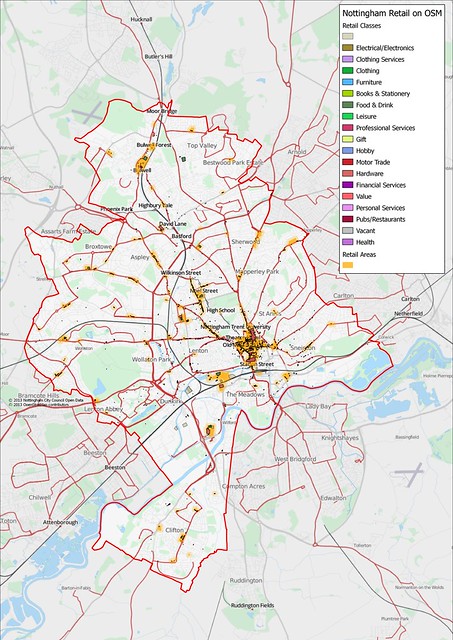 |
| Retail landuse and retail outlets in the city of Nottingham (a buffer is used to accentuate smaller retail outlets) |
This morning I achieved one of my targets for using Nottingham Open Data. This was 90% reconciliation of the Licensed Premises dataset (this compares with around 40% when I first blogged about it).
 |
| Tabulation of reconciliation of Nottingham Open Data Licensed Premises File vs OSM (loaded as an image because turning my Excel stuff into an HTML table is a PITA). |
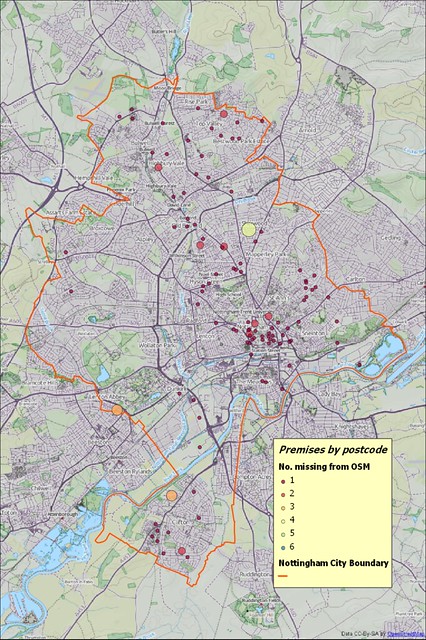 |
| Licensed premises from Nottingham Open Data not reconciled to OpenStreetMap (plotted as number of premises at postcode centroid) cf. with original map. |
Most mapping sessions have been just over an hour in length, mainly involve photo mapping and seem to generate a huge amount of data. With a small number of exceptions in the City Centre I haven't done repeat surveys. Apart from trying to take lots of photos I have not tried to map everything I came across, which has been my usual approach in the past. I started doing this on my first outing, and took 30 minutes before I mapped my first shop, and had only 10 minutes for other shops, so I was going to take forever doing it my old way. So I stopped worrying about grabbing everything and just tried to get shops, but did collect other information if it was convenient and readily accessible.
I distinguish between these two styles of mapping, by analogy with farming, as intensive and extensive. In one we put all our efforts into maximising yield (of crop, or OSM data) from a small number of hectares; in the other we are happy if the yield is good enough.
What I've done.
- Added postcodes to as many as 5,000 objects. (It's a little difficult to check as I have touched objects which already had postcodes).
- Added around 1,200 different postcodes, about 20% of the city. (Again some may have already been present.)
- Added around 5,800 housenumbers. These are not just retail premises, but houses close to shopping areas, and when I've walked along streets I've tried to add house numbers at intersecting streets.
- Added over 2,500 buildings.
- Taken 7,000 photos. Of which around 6000 are now available on OpenStreetView.
- Recorded about 13 hours of mapping audio.
- Loaded around 200 kilometers of GPX tracks.
- Finish adding POIs for shops (particularly in the City Centre).
- Indoor mapping in the two main Shopping Centres (Malls) in the middle of the city.
- Finish adding building outlines in the retail landuse polygons (I'm tending to do smaller ones first)
Things I've learnt (and why)
- Map all shops in a group together. If a single shop changes use or closes and the row of shops has been mapped it is often impossible to reconcile which shop has been affected. It's far better to be systematic for a small area than mapping patchily. Exceptions can be made for very recognisable buildings or POIs. (This also helps check that POIs are in the correct location, see below).
- Open Data Addresses are great. The Open Data is not accurately geo-located (only to postcode), but it does contain the address. This meant that as long as I could locate the business on Bing aerials I did not need to collect detailed address data. This made surveying less arduous.
- Good high-quality building outlines help. A single building outline covering a whole block is useless. A lot of Nottingham City Centre had building polygons mapped not from aerial photography but from OSGB StreetView. Firstly the building outlines were not very accurate. Secondly, it is very time consuming to divide and correct such amorphous polygons.
- Good photos and; decent aerial photos are critical. I have taken a huge number of photos (all available on OpenStreetView) to assist this mapping. I try and get photos of the roof line as I can correlate chimneys, dormer windows and other roof-line features between the aerial photos and my street level ones. It is amazingly easy to displace a POI a few tens of metres even with all this information.
- Android Apps aren't much use in a City Centre. I made some use of KeyPadMapper3, but found the data often needed to be tweaked because my android phone GPS location wasn't too good. In the City Centre the canyon effect even with a Garmin is too much. A further reason not to use the phone is that I was already using a camera, two GPS (one in the backpack) and a digital voice recorder, juggling these and the phone was too much. The phone did come into it's own when the batteries ran out on the dictaphone. In the end I used the voice recorder for most addresses I collected. I didn't try Vespucci.
- History of POIs is enormously helpful. Most of the errors in the Open Data are failures to update historical data (POIs closing, changing ownership, re-branding, or moving elsewhere). In many cases Nottingham mappers have kept the historical information when updating POIs, and this means that it's mush easier to reconcile OSM with the Local Open Data.
- It's really difficult to tell if some POIs are still open. See the associated post on Vanishing Pubs.
- Night-time surveying is the only way to check the status of some Bars, Nightclubs and Fast Food outlets. I'm too old to be a night owl, so someone else needs to do this.
- POIs change fast. (Well I already knew this) My re-surveying of Market Street, Mansfield Road and Upper Parliament Street/Forman Street, which were all done 2 years ago by Paul Williams enables the rate of change to be quantified.
- A 5% error rate in local government open data seems a reasonable assumption. This is not too different from rates found with NaPTAN and Ordnance Suryey Open Data Locator. It does mean that it's far better to use this data as the basis for survey (as we have done with Locator) rather than import (as was done with NaPTAN).
- Local Government Open Data needs significant interpretation. It is collected for discrete purposes, and there is no integration across data sets. I presume licences are granted for a number of years. Therefore there are no checks as to whether the licence is still in use, or even has ever been used, until renewal time.
- Extensive surveying is more fun, and less exhausting, than intensive surveying. By an intensive survey I mean one intended to collect all types of mapping data in a discrete area. Extensive surveying involves covering a larger area perhaps with some specific targets, but most information is collected as a side product rather than with deliberation.
- It was a good mapping project. A targeted set of POIs makes for a reasonable mapping project over a shortish term.
- More Systematic Coverage. Extensive surveying means more systematic coverage of the city: even if not in great detail.
What to do next
The next steps are fairly obvious.
Repeat for Food Hygiene Data. I have an additional data source from the City Council which covers POIs which serve food (anything from fast food outlets to schools and hospitals). This is about twice the size of the Licensed Premises file (2400+ cf. 1200 POIs) and at the moment I have only reconciled 70% of the data. In the main this means checking more day nurseries, care homes and similar establishments.
Change Detection. Build a mechanism for automatically detecting change in the source data. So far I have just used a snapshot of the data, but it would be very useful to find changes in the source data files and use them to drive surveys.
Create additional tools for Food Hygiene data. The Food Hygiene data is actually available for many parts of the UK and is Open Data. There are at least 350,000 POIs available. It is usually safe to assume that it is accurate at the postcode level, but in the nature of retail outlets several are usual present in each postcode. It would be nice to be able to create layers for mapping (e.g., in JOSM, Potlatch etc) which spread the FHRS POIs out around their postcode location preferably ordered by housenumber in the right direction. It would also be good to be able to load subsets of this data as POIs or similar into Garmin or Android devices.
Developing sensible categories for retail. In some of the images in this blog post I have used an ad hoc categorisation of available amenity=* and shop=* values. It would be useful to develop a more considered version of these categories.
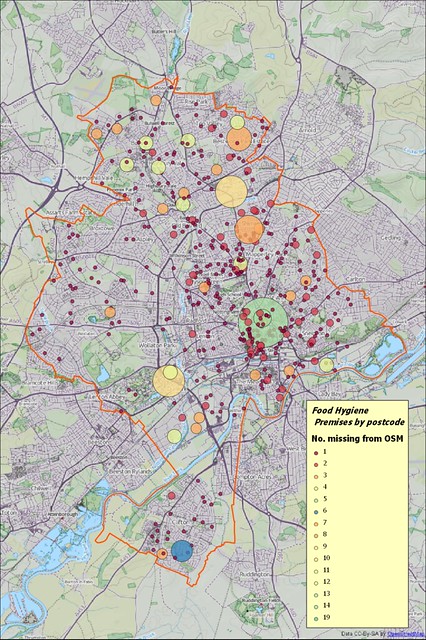 |
| Premises from Nottingham Open Data Food Hygiene file not reconciled with OpenStreetMap (cf. with image above). |
Conclusion
The most important thing is that this project would never have started without the availability of Local Government Data. Although I could have tried to find and map retail outlets I would have missed many isolated ones, and would have had no idea how many more there were to find.With retail data mapped systematically it becomes possible to evaluate exactly how we use tags and if there are any obvious improvements. Remember that Nottingham is the 8th largest retail centre in the United Kingdom and is therefore a reasonable exemplar for all but the largest retail centres in Europe and North America.
A consequence of trying to be systematic is that I have visited areas of the city which have had very little on-the-ground mapping. I have been able to collect other POIs, addresses, correct road alignments etc.
Lastly, this is a very productive and rewarding means of mapping. If you have any local open data on shops I recommend a bit of Retail Therapy.
Subscribe to:
Posts (Atom)