Monday 24 January 2011
Heat Maps from OSM POIs
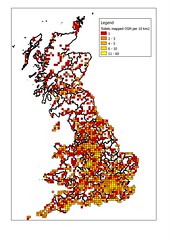
I've been playing with other sets of POI (Point of Interest) data from my recent copy of OSM for Great Britain. QGIS does not generate heatmaps isopleths, but I've been able to create very simple data sets to load into OpenHeatMap. The example shows amenity=toilet data aggregated to a 10km OSGB grid: a recent Project of the Week. Once the basics have been mastered it's very quick to create a nice looking heat map. The interface is clean, uncluttered and has simple to use instructions and there is also a short video which actually bears watching. I've also added the popular pub grid as a heat map. The same toilet data shown on a grid is available on Flickr.
Subscribe to:
Post Comments (Atom)
Cool :) Should the legend say "per 100km2" or did I misunderstand?
ReplyDelete