Tuesday 25 January 2011

Simulating Urban Atlas using OSM

A few days ago the EEA Urban Atlas data came to my notice (thanks mackerski). I blogged my preliminary impressions, noting that it should be possible to use OSM as a starting baseline for such data. Today I show that this is not only possible, but straightforward and quick.

The main picture shows OSM data for the city of Nottingham and surrounding district councils of Ashfield, Broxtowe, Erewash, Gedling and Rushcliffe (area UK029L in Urban Atlas). Data have been plotted for each land cover class in Urban Atlas, except that all residential areas have been plotted as class 11220.

The basic methodology was as follows:

  • Download OSM extract for England from Geofabrik.

  • Extract a bounding box using osmosis

  • Load the bounding box into PostGIS using osm2pqsql

  • Extract a shape file for each landcover class using PostGIS

  • Layer shape files and change symbology in PostGIS


Output was generated so as to resemble the PDF file distributed by the Urban Atlas project for the Nottingham area (included in this zip file). A legend was not generated for technical reasons concerning QGIS.

A few remarks about the processing:
  • Roads and railways were buffered to generate an approximate landcover with buffers of 30m for motorways, 15m for primary and trunk roads, 10m for railways, 7.5m for secondary roads, 5 m for tertiary and 3.75m for others.
  • Residential areas were not broken down as comprehensive building outlines are not available in OSM. Furthermore, residential areas would require breaking down using intersection operations before this could be done.
  • Nature reserves should have been processed with agriculture. No doubt other groups of polygons were probably missed accidentally.
  • Spherical mercator projection was used throughout because I could not easily get the projection option of osm2pgsql to work under windows.
The next step is to repeat this within PostGIS and do a direct comparison with the official data. However, there are some obvious edits which I can do now to make the OSM data even better.

Oh, and how long did it take me: just over 3 hours, and it would have been faster if I hadn't clipped the bounding box a little too tightly on the first pass.

Monday 24 January 2011

Heat Maps from OSM POIs


I've been playing with other sets of POI (Point of Interest) data from my recent copy of OSM for Great Britain. QGIS does not generate heatmaps isopleths, but I've been able to create very simple data sets to load into OpenHeatMap. The example shows amenity=toilet data aggregated to a 10km OSGB grid: a recent Project of the Week. Once the basics have been mastered it's very quick to create a nice looking heat map. The interface is clean, uncluttered and has simple to use instructions and there is also a short video which actually bears watching. I've also added the popular pub grid as a heat map. The same toilet data shown on a grid is available on Flickr.

Sunday 23 January 2011

Pub Density on OpenStreetMap

Pub Density on OpenStreetMap
Originally uploaded by SK53 OSM
OpenStreetMap data for Great Britain were downloaded from Geofabrik on 22 Jan. 2011, uploaded to a PostGIS database using osm2pgsql. Nodes and Ways tagged with amenity=pub were assigned to centroids of 5 km square grid based on the Ordnance Survey National Grid and the number of pubs in each square counted.

The grid was generated, pubs counted, and output generated using Quantum GIS.

Pub density is obviously population dependant, but on OSM it is also a likely indication of ground survey (named pubs even more so). It is unlikely that many 5km squares in England actually lack pubs, so gaps in the background probably indicate poorly surveyed areas. More on this anon.

Tuesday 18 January 2011

The Rogue Polygon and Urban Atlas


OSM's bard was having problems yesterday with
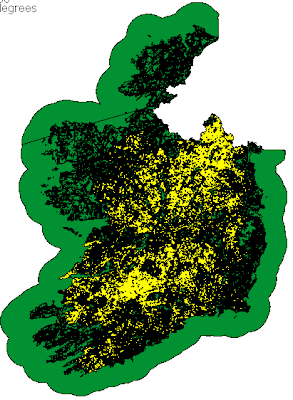
 Corine data for Ireland. It turned out that the Corine class 231 (permanent pasture) ran more or less continuously through Ireland from Malin Head to Kinsale Head. This created a single relation with around 17,000 members, the "rogue polygon" (see image). Needless to say required a lot of processing with osm2pgsql for rendering with mapnik. At least it might be accurate rather than the large healthcare facility that Google thinks exists in Letterkenny.

I learnt about the related EEA (European Environment Agency) project called the 
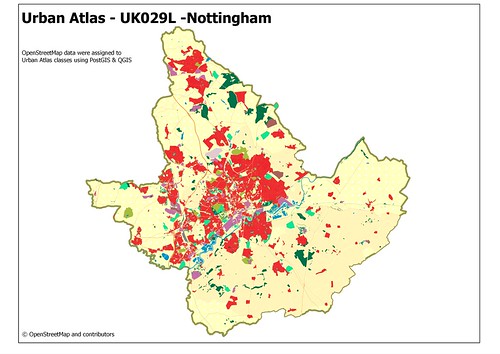
Urban Atlas. This uses a similar classification of landuse to Corine, but a much smaller minimum size for survey units. The maps produced have a lot of detail and look very interesting. Compared to some other countries the UK has only got coverage of a limited number of cities. But, Nottingham is included. In fact the Nottingham Urban Atlas covers a huge area apparently contiguous with the boundaries of the Districts of Erewash, Broxtowe, Rushcliffe, Ashfield, Mansfield and Gedling, and Nottingham Unitary Authority.

In some parts of Europe, such as Poland, Urban Atlas data is being prepared for import to OSM. Although not interested in the data for import I expected it data to be useful for two reasons in the first instance: completeness of coverage, and as a control for OSM tagging. The Corine division of urban fabric (roughly equivalent to OSM landuse=residential) makes useful distinctions with regards to density and continuity of urban areas, which, to date, are under represented in OSM. This type of distinction has a long history in landuse mapping. In earlier days it was concerned with urban areas which could be productive for fruit and vegetables. Nowadays, water run-off and nature conservation issues are probably more significant. As a mapper one is always aware of the difference, but I, for one, don't try and capture it explicitly. The Urban Atlas methodology has criteria which it should not be too hard to adapt for OSM, but we do need to think about appropriate tagging.

Of course the first area I looked at in the Nottingham Urban Atlas data was the two slices I've mapped this year. Part of the point of combining survey and Bing data is to capture quantitative information about landuse. So here is the area from the Urban Atlas, using the standard colour scheme:


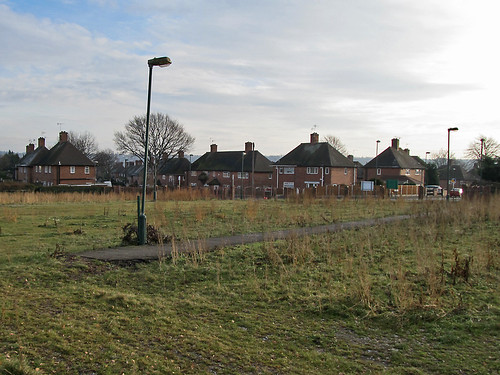
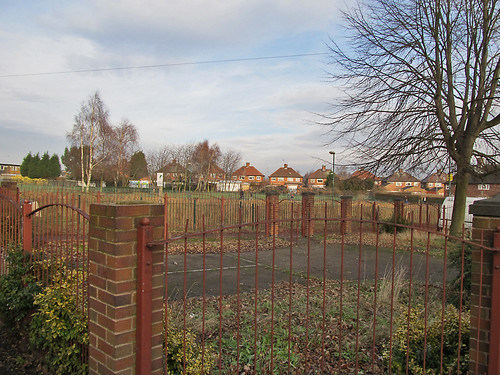
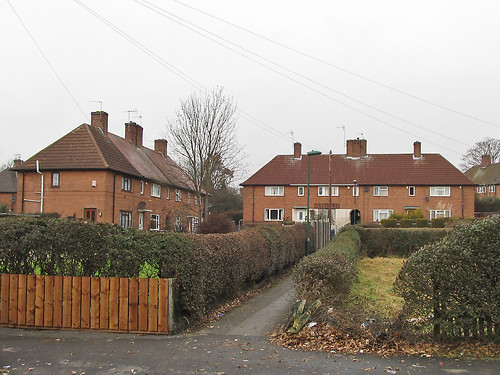
The first thing which strikes me is that the Edwards Lane Estate is not given a uniform classification. This seems very odd: the estate is clearly a single uniform design including road widths, garden sizes, house types. I assume that it was planned with a specific population density in mind, and specific guidelines in terms of percentage of the area devoted to houses, gardens, open space and road infrastructure. Here's the same data with houses I've recently mapped in OSM : it's very clear that areas with identical numbers of identical houses have been assigned to different categories:


So note the darker red areas with code 11210 : on the ground this is indistinguishable from the rest of the estate (coded 11220) . All I can conclude is that the data were not subjected to ground validation: an overview of the methodology is shown in this presentation. Detailed inspection of other well-mapped areas reveals similar minor anomalies: industrial and commercial areas spilling over to residential blocks; areas in campuses (colleges, hospitals and universities) being incorrectly assigned to residential categories; and soon and so forth. These nuances probably don't affect the reliability of the data for its purpose, but they do reflect how the data was sourced. One issue might be how parcel boundaries are selected, which may have the effect of putting all of some shared resource in one parcel (such as a kids' playground). I'd hoped to find time to measure housing density based on OSM data for the shapes shown above, and thus have more confirmation. It will have to wait for another time.

The bottom line: this sort of data set can be created as a side effect of areas which have already been mapped in OSM. A small amount of additional tagging is needed on residential areas, but otherwise a comparable dataset can already be produced for much of the Nottingham area. The EEA should start considering OSM as a primary source for any extensions of this dataset in places like Germany and many parts of the UK. OSM data is likely to be more accurate, reflect better understanding of the locale, and be more up-to-date.

Postscript. I find it slightly boggling that I'm disparaging a data set which two years ago I would have thought was fantastic. It's great to find how powerful OSM is becoming.

Friday 14 January 2011

Gone

I alluded earlier to two sites I surveyed last week where buildings have disappeared since the Bing imagery was taken. Both are also still shown on OS StreetView, and other OS sourced maps. Finding such places always makes the effort involved in ground survey, worth while.

Rosecroft Court


A fairly rare type of inter-war housing in Nottingham. They consisted of 12 dwellings in a block with 6 entrances on each side of the block. I have never worked out if they are maisonettes or back-to-backs. There are still a few scattered around the city. No doubt small and difficult to let. Note the jump in house numbering around the missing buildings.


View Larger Map

Rosecroft Court : 1178a

Rosecroft Court : 1174a


Hawyard School

A comprehensive school built, at least in part, on former railway land. Falling rolls led to its closure. Demolished to reduce any additional vandalism.


View Larger Map

Hayward School site : 1332a

Hayward School site : 1127a

How good is MasterMap?

I've been reflecting on the buildings which have recently been demolished on the Edwards Lane Estate. Both Rosecroft Court and Hayward School still appear on the Ordnance Survey MasterMap available at Nottingham City Council's Nomad site. Now I don't know how frequently this data is refreshed, so it may be that the council only update occasionally.


I thought I'd look a bit closer to home, and selected this little bounding box shown above in aerial photos Bing from 2008 (slightly earlier aerial photos from Google here). I'd like to show the actual MasterMap data, but I suspect that posting on a blog is well outside "for private use".

Anyway within this bounding box I can find the following inaccuracies compared to what is on the ground, with a planning application reference when its been easy to find it quickly:
  1. Pavilion on playing field, Jubilee Campus. Originally built as changing rooms for Cottesmore School, for the past 10 years this was used as a storage facility by the Estates department of the university. Demolished in 2009.
  2. Cycleway on playing field, Jubilee Campus. Installed during 2009 to reflect the brutal reality that this was the route the vast majority of cyclists and pedestrians used, rather tahn the longer path to the west.
  3. Large garage, Lenton Lodge. Built around 1995-6 (95/00584/PFUL3).
  4. Former Police Station, Charnock Walk. Demolished sometime during the 1970s.
  5. Grass area in front of Lenton Lodge. Fenced in around 1977, when the Lodge ceased to be used as tied accomodation for workers in the council Parks department.
  6. Former Ladies toilet, including access, in south wing of Lenton Lodge. Closed in the '70s either on, or before, change of use for the lodge.
  7. 17, Wollaton Hall Drive, Extension built to rear (91/10013/PFUL3)
  8. 18, Wollaton Hall Drive. Extension built to the east of the house, perhaps 20 years ago.
  9. 20, Wollaton Hall Drive. Extension to rear.
  10. 22, Wollaton Hall Drive. Extension to rear. (92/01923/PFUL3)
  11. 49, Charnock Avenue, Large extension built to rear.
  12. 51, Charnock Avenue, Two extensions built, last in 2010.
Note that these are just the obvious ones culled from memory, with one or two checked against the planning applications site. If I went and specifically surveyed for them (and used Bing, the council site etc.,) I'd expect to double the size of this list.

There is a high degree of change, which is, no doubt, a reflection of the area.

In the past 15 years many houses in a whole swathe of the city have been bought by private landlords for renting to students. Larger houses are also attractive to extended families with couples of two or more generations living in the same property (both often identifiable by the presence of large numbers of cars, and most of the front garden given over to parking).

The same phenomenon of change is, however, true of the Dales Estate in Sherwood, which I surveyed earlier in the week. My impression was that this area is still owner-occupied by single-family units, but there are many obvious extensions, and quite a bit of building activity happening right now. In contrast, the houses on the Edwards Lane Estate (last week's survey target) mainly have their original appearance. Many are no doubt still social housing (plenty of Nottingham City Homes vans in evidence), but there were a few "For Sale" signs indicating some owner-occupation. It would be interesting to see if similar inaccuracies apply to these areas.

The Ordnance Survey makes much of the speed, frequency and precision of MasterMap updates. However this cursory look suggests that there side of the story is partial at least. I'm sure there is much I have missed, but hese are the implications which I can see initially:
  • By drawing building outlines, from up-to-date aerial imagery, OSM can offer more accurate information than the OS, although we will never achieve their precision. Note, how much the trade-off between information currency and precision is reflected here (maps "good enough" for their purpose).
  • Planning applicants are required to submit MasterMap output with their applications, and the derived fee income must form be a significant part of the OS revenue: I would guess a few million quid. The OS is a monopoly provider and has no incentive to keep this information up to date for its captive market.
  • Councils raise revenue through council tax on domestic properties. Inaccurate information on the size of properties could affect the accuracy of rating valuations.
  • Property size, gardens converted into parking areas, and so forth have other effects. The most obvious is increasing the direct run-off from rainfall. It is known that this has affected the hydrography of many parts of England (although changed farming practice may be much more significant), with consequences for storm drainage and flood defence. Again, failure to track change may result in under-estimation of any ensuing problems.

Thursday 13 January 2011

Twitchell

Twitchell : 1202b
I'm going to be using the word "Twitchell" a lot here in the near future. Usually a twitchell is a narrow path connecting two roads, but from the mid-1920s to the mid-1950s groups of houses accessed down a twitchell were a characteristic feature of the council estates built by the then Nottingham Borough Council. The picture shows a typical one from the Edwards Lane Estate (built just pre-WWII, more later). I presume the gardens were originally fenced, but privet hedges were standard when I was growing up in the 1960s (not much else could survive in the air polluted by coal fires and local industry).

There is surprisingly little on the web about it, here are a couple of the more useful posts I've been able to find:

This is what the OED tells us about twitchell and twitten:

twitchel - dial. Forms: 5 twe-, twychel(l, twachylle, 8­9 twitchel, -ell.
[An alteration, or a variant with different suffix, of ME. twychen, late OE. twichene, OE. twycene, twicen a fork in a road, a forked way.
The form twychen survived in ME. times in Oxford in the names of special passages or lanes: see Wood City of Oxford (O.H.S.) I. viii. 187, 199, 223, etc., and Hurst Oxford Topogr. (O.H.S.) 186, 197. In Lanc. and Yorksh. the reduced form twitch is still in use. Cf. also twitten.]
A narrow passage between walls or hedges.

Twitten - [Perh. related to LG. twiete alley, land; but cf. also OE. twicen and twitchel1.]
A narrow path or passage between two walls or hedges.

Posted by céline on November 16, 2004 8:23 AM

from Naked Translations "twitten"

and this
I was born "up the gennel" Bestwood colliery village Nottm. There it refers to the alleyway between the backs of two parallel rows of houses with walled back yards. It was wide enough for the dustbin lorry to drive down and empty the middens that were accessed either side of the gennel via a wooden door set half way up the wall for each house. I understood that a Twitchel was a wide usually hedged alleyway as was a gitty, but more narrow. Whilst an "Entry"was the narrow passage in the middle of a row of terraced houses leading to the backs of the houses, the rooms on the first floor either side covered it over the top making it like a tunnel.


As the latter quote suggests the local terminology may be much more complex. The houses in the picture at the top have 'entries' to the back doors of the middle two properties. This dialect word also survives as a street name, "The Twitchell" in Chilwell, and a Weatherspoons pub in Long Eaton is called the "Twitchel Inn". Nominatim shows other uses, a street in Sutton-in-Ashfield, and a footway in Melbourne, Derbyshire, and, oddly, a street as far away as Baldock in Hertfordshire.

Monday 10 January 2011

I've been guerilla mapped!

Post Box NG8 242 : 1300aLivingwithDragons gave a talk at SotM 2010 on guerilla mapping, and in November he came to Nottingham for WhereCampUK. I knew he'd been doing some mapping at the time, but today I noticed a post box right in my local patch on my garmin which I couldn't remember mapping. I had to go and check lo and behold, there was a new post box, mapped by Gregory. It's been on OSM since December 3, and I'd not noticed it, either on the ground or on the map. THE SHAME.

This post box must be quite new, it's not on Matthew Somerville's list, and I haven't seen this precise shape before. Is it the first post-FOI request postbox on OSM?